

 FORECASTING
Why forecasting is important:
- Managers use it for future capital allocations
- Analysts make forecasts to communicate their view of a firm’s prospects
- Creditors make forecasts in order to determine whether their debtors can be repaid
- Investment bankers use it to determine who to engage in hostile takeovers.

Good Forecasts of three core elements:
- Integrated Forecast: forecast the income statement, balance sheet and cash flow statements together; if we assume that growth rates hold for the next 10 years that means we are assuming the asset turnovers are increase substantially as sales are growing.
- Realistic Assumptions: sales growth, assets growth, asset turnover, debt levels, profit margins should be realistic
- Robustness: the forecasting process should produce numbers that are not too dependent on a few key assumptions.
EBIT * i-t)
+ Dep
- DowC
+/- CAPEX
FCF
- Dangerous to put your work out to the public.
- Reduce CAPEX. The net impact will have a higher FCF.
- PP&E does down they are not investing in PP&E.
- You shouldn’t start with Free Cashflow Assets; we need to come up with free
- And then see what false.
Maybe we are adopting ratios:
- Genera Mills; I have historical margins but what are we going to do.
- If you have 100% mispricing.
Detailed Forecast
- Forecast detailed line items on income statement and balance sheet
- Can be tedious
- Individual ratios can be volatile
- Many line items may not have a natural “driver”
- May be essential in settings where condensed forecasting is insufficient –and you care about individual assets/liabilities e.g. credit providers, bankruptcy
Condensed Forecast
- Forecast condensed income statement and balance sheet
- Fewer assumptions –can pay attention to each assumption
- Less volatility
- Wont work in some settings –as discussed above
Detailed Forecast:
Can be tedious…
Building your Business valuation Forecasts…

Assumption #1: Revenue Growth
Easy to have small growth for example Apple has returned to mean, you might say. That’s a cynical view but it’s a sensible one. Why can’t you have massive growth every year? The answer is that competitors will enter to disrupt the Apple’s of your industry. For example, Samsung phones look a lot like Apple’s. The operating system from Apple with it’s GUI seemed copied by Microsoft.
So, pay attention to recent growth, be aware of mean reversion.
Consider the Macroeconomics in Ontario: the new US tax and economic performance post-2016 election say the Canadian dollar go up.
Consider the Industry and Firm factors: is there a new evolutionary product.
Separate out sales from existing resources and sales from new resources.
When creating your forecast, try to consider the product line channels if the information is available around price and volume but you should look at aggregate sales growth in your analysis.

Assumption #2: Operating Expenses
Operating expenses are in the Income Statement. You need to forecast the operating expenses as a % of the Revenues.
Factors to consider:
So what factors should you consider?
You should look at the expenses ratio: levels and trends.
Expansion in to the new markets should lead to a) an increase in operating expenses. Here you would build a market. You might have to lower prices. Operating expenses then you expect margins to grow through efficient. However, recall that growth does not equal efficiency. Growth is very inefficient.
ROE and ROAs tend to mean revert they are driven by mean reversion in profit margin? Why? Again, competitors and structural changes to the company. Why if the ROE is below-> everything reverts to the mean. Remember that General Motors gave their employees 25% of the company so that they could get the union pensions off their books.
Your analysis may decide to have a more granular approach here ie. Forecast the COGS, SG&A, R&D separately.
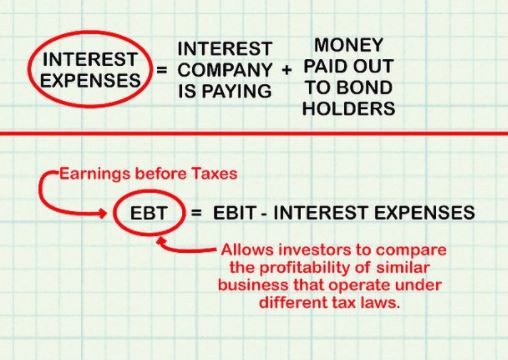
Assumption #3: Net Interest Expense
This has nothing to do with revenue – it’s a function of lagged net debt. Pay more attention to recent information – interest rates from 3 to 4 years ago are less relevant. Interest expenses rises. Can a firm have a negative net debt? Apple has negative net debt. They have more cash. Apple can have negative net debt.
Usually a negative interest expense (i.e. income) – can estimate rate.

Assumption #4: Taxes
Examine the tax footnotes in the company Financial Statements. In most cases, can be extrapolated from prior data. Some times, tax rates are “all over the map”.
Remove the impractice of one item that can distort tax rates i.e. non-deductible goodwill impairments. Take a look at the historical analysis.
Assumption #5: Net Operating Working Capital
Operating Working Capital = working capital cash + non-cash current assets – current liabilities. Remember this is an ‘inverse’ turnover ratio – more implies a worsening turnover.
Examine the trend in prior lagged OWV/Sales. What should happen to this ratio if a firm is converting to a Just-In-Time inventory system b) decreases: inventory gets smaller therefore you would expect the efficiency of the firm to increases the FCF.
Negative Operating Working Capital/Sales may not be sustainable. You may need to forecast this ratio to zero and eventually positive.
Net Income
+Interest
+ Depreciation
Change in OWC
CAPEX
= FCF
Assumption 6: Net Long-term Assets
- Net Longterm Assets = long term assets less depreciation and amortization – Lonterm liabilities not related to debt.
- Remember this is also an ‘inverse’ turnover ratio more implies a worsening turnover.
- Examing the trend in prior lagged Net Longterm Assets / Sales
- What should happen o Net Longterm/Sales if you’re converting bricks and mortar stores to e-retailing:
- It decrease CAPEX and increases FCF (Free Cash Flows).

Assumption 7: Liabilities
- Payout Approach : you can calculate retention ratio – incorporating repurchases if necessary.
- Startup Retention Ratio: retention percentage (a) 100%
- You should not be chasing dividends. 100% were not paying any dividends what about the mature firms. Mature firms you’d expect 00%
- What phase is the firm in based on the retention ratio.
- Balance Sheet: net assets = net capital
- Set = ShEt – 1 + Forecast Net Income * Retention Ratio.
- Retention Ratio: is how much….DEFINITION HERE.
- Payout Ratio = Annual dividend per share/ Net Income
- Retention Ratio = Retained Earnings/Net Income
- Retained Earning = – Dividend / Net Income
- Startups have almost 100% retention ratio!
- Some will buy into older companies because the dividend payout is usually higher.
- Debt will be the implicit plug in this model: what if the firm has positive net debt? Maybe something happened. Debt to Equity is D/E More economic intuition in the retention price. You should look at higher growth: pessimistic scenarios our demand film.
- We will do financial statement analysis
Capital Structure Approach:
Break up Net Assets into Net Debt and Equity using the targeted capital structure. Payout is the implicit plug here.
Sensitivity Analysis
- Forecasts are based on the expected or most realistic set of assumptions.
- Important to consider at least two other scenarios:
- Optimistic scenario – higher growth, lower cost, lower asset ratios;
- Pessimistic scenarios – lower growth, higher cost, higher asset ratios.
- Advantage of condensed approach: can focus on some key ratios – sales growth, operating expenses, Net Longterm Assets.
Interpreting Forecasting Financials:
- Can do ratio analysis as forecasting financials.
- How well is the firm forecaste to perform?
- Are assumptions reasonable> trends in longterm ROE – do try to make sense?
Estimate the Free cash Flows from Condensed Forecasts
- Can one estimate Free Cash Flow? Forecasting is not a science! No kidding. False sense of precision. Paying excessive dividends.
- Turns out one does not need them as: change Net Longterm Assets = Capex – Depreciation
- It is easy to express enterprice Fress Cash Flow as follows;
- FCF = Net inceom + Net Interst * (1-Tax Rate) – change Net Longterm Assets = Change net Operating Working Capital.
Excel for Financial Analysis
Instead of using =Sum(F10,F11) try =+F10+F11. If you want an amount that displays as positive to be negative try =-F13. Let’s say you want to test is your numbers are balance: try the following:
=+F12=’Income Statement’!E18
You are asking Excel to state that =Number equals another number: the output will be true or false. You want to minus 1 when doing the Revenue previous year.
Summary
- Forecasting is not a science
- False sense of precision
- Forecasting is also not an “art”
- In my opinion, forecasting is educated guesswork
- A condensed approach allows one to capture most important elements without getting bogged down
- Forecasts only as good as the assumptions and the underlying analyses
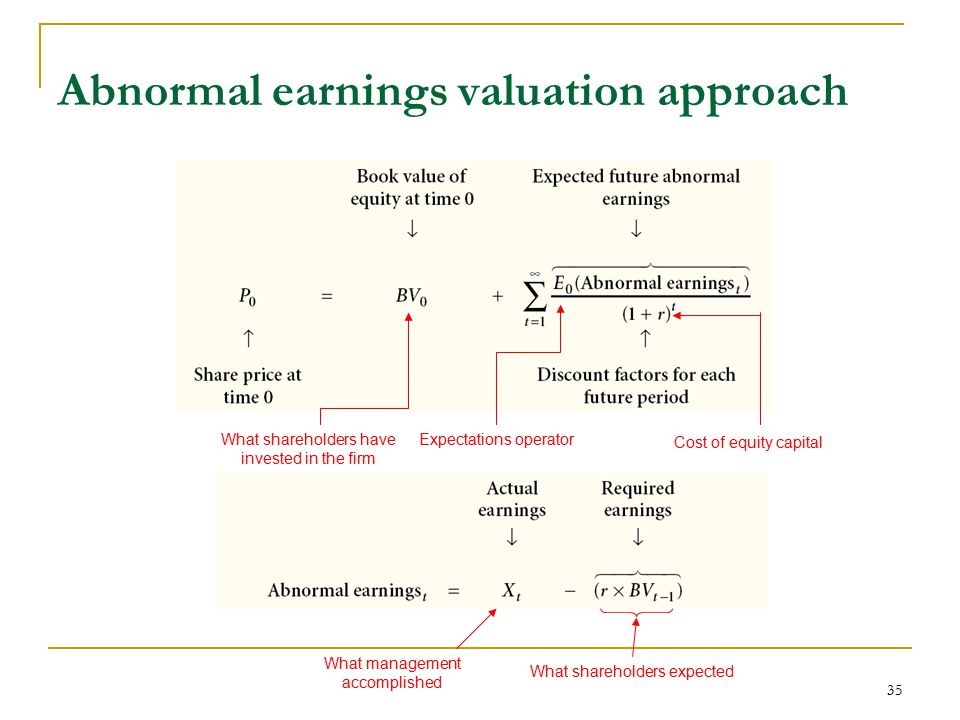
Abnormal Earnings Valuation
Better than Discounted Free Cashflows:
- Terminal value is misleading and is very sensitive to small changes in assumptions;
- Current earnings are better predictors of future cash flow than current cash flows numbers
- DCF ignores accounting numbers; there is an attempt to reverse out the effects of accrual accounting when we calculate free cash flows numbers; DCF completely ignores the balance sheet.
- Terminal value estimates do not have an economic intuitive; 3% perpetual growth doesn’t really happen in the real world.
- Negative cash flows happen and yet DCF invariably leaders to a positive terminal value.
- Circularity of getting the WACC and using WACC to estimate value; which needs free cash flow to equity method.
Abnormal Earnings Valuation the Details
- Terminal value numbers are smaller part of the valuation, thus reducing the sensitivity to estimate assumptions.
- Earnings are used instead of cashflows.
- We use the accounting numbers including the Balance Sheet through Book Value.
- Uses industry economics the that in the long run profitability tends to converge to an industry level median.
- Negative earnings are not a problem. Persistent negative earnings will simply mean the firm has negative abnormal earnings.
- The most common form of AEV is conducted at the EQUITY level. Therefore the problem of circularity is avoided.
Abnormal Earnings How It Works
First what are normal earnings. Those earnings are that are equal between the ROE and the cost of Equity. Return on Equity as a percentage and the Cost of Equity as a percentage. Any earnings above the normal earnings are abnormal earnings. If a firm has a cost of equity of 15% and a book value of equity (BVE) of $1million and a Net Income of $200K, it’s normal earnings are 15%*$1million = $150K and it’s abnormal earnings are then $50K.
Abnormal Earnings should disappear overtime as firms move towards an Industry ROE.