
Models of Voting Behavior:
If you don’t know about these models you’re screwed!
• Research on voting behavior focused on political orientation or social background characteristics.
• Academics seemed to focus on these two models: developed in the US and widely used. They came to be seen as competing models. 2nd model was a critic of the 1st model.
• EACH SCHOOLS characterization of the other school’s models striped away the other model.
1) The Columbia School Model: Sociological Model by Godey

• First major study based on modern methods (Ohio) – US Presidential Election 1940. You see what percentage voted NDP, Liberal: they went out to interview people systematically. America was in upstate New York for them. Compared to Eerie Ohio and Amera, NY.
• What was interesting was how the voters made up their minds. They went back to interview people on 7 different occasions. The 7th interview was after the election. They tracked people. How did people change over the course of the campaign? How do people choose a president?
• There was little literature on surveys: you have to formulate expectations: you have to ask the correct questions.
• The OBJECTIVE – try to understand how people would make up their mind during a campaign.
• The ANALOGIES – What process would you liken voting to? How to choose a life mate? (Social network). Columbia School came up with Purchase decisions as the method for making a voting choice:
• They likened these parties to market products: advertising = promotional campaign to buy product. Voters = Consumers.
• Interested in the psychology of choice. How did advertising by parties affect people’s voting choice?
• There was a belief that the media could have massive effects.
• That’s why scientistis studied a small communities: they would have the same influence, same media, and same radio stations.
However, they choose a really bad election: 1940 election was unfortunate because there was a war. FDR was running for his third term. You didn’t need the campaign to help you decide that Roosevelt was effective or not. Brand Loyalty was substantially high. THEREFORE THE campaign had minimal effects.
• Very few changed their votes. Few people were undecided. It was the staunch Democrats and staunch Republicans: if you were a Republican your vote would be crystallized. WHY was the effect only to reinforce?
• You have to take your core seriously. You need to remind them why they are Liberal or Conservative BUT you do need to reach out.
• WHAT happened was that Republicans paid attention to Republican ideas and Democrats paid attention only to Democratic ideas? Each systematically over-estimated their chances of winning.
• The undecided felt conflicted, this is called: cross-sectional pressures.
• They were disappointed with the results.
The Sociological Model of Voting
• Secondary Factors: Primary Factors:
Socio-Economic Status________________>
• Sex________________________>
Religious and Ethnic Group Affiliation___> VOTE
• Age________________________>
Regional and Urban Rural Differences____>
The Index of Political Predisposition (IPP): can use it to make predictions about how people will vote. Protestants are very likely to vote Republican. Catholics are very likely to vote Democratic.
• Model contends that voting is a group experience: people who work together, neighbors
• Opinion Leaders played a key role: it makes you think of people who are elite but opinion leaders were the most interested: the political junkies.
• Two step flow of communication: opinion leaders listen to media; opinion leaders talk to other people & pass on media messages. They talk to other people. The two-step flow of the hypothesis.
CRITICISMS of the Columbian School Model:
Cross-pressures are extremely important. The Index of Political Predisposing was a scale: very effective if you fell in the middle of the index about a certain issue.
This model says that politics doesn’t matter! where’s the politics in all of this? What about the issues? Leaders?
This model doesn’t take into account the personal interests and obfuscation on the part of parties.
• How can you explain that electoral outcome vary so much?
• Social background characteristics don’t change. Very few people change religion.
• Not enough change between elections to change the outcome of an election.
• The model is much too static.
• Why would religion have an impact? Social networks and teachings. The Priests used to tell people how they should vote.
• Religion may have nothing to do with Party choice and making some other factor. (Catholics traditionally poor, protestants rich)
• The Columbian Model doesn’t work that well in the Canada. Knowing their social background only gets you so far.
• The Index of Predisposition is only accurate 60% of the time.
• Cross-pressures are crucial: Is a sociological model the notion of cross pressures. They didn’t view social background characterizes as conclusive. Catholics in Western Canada. Strong sense of grievance against Ottawa. Your religious affiliation: Catholic Ukrainian but do they vote Liberal?
• Some people can’t resolve the dissonance and will not bother to vote.
• For others, it will depend on the campaign.
• If a campaign plays up region, region will trump religion, and so on. So now politics matters!!!
• Once you start talking about the leader and you can see the campaign is important.
• They didn’t see social categories as important themselves.
• Social background: you know who they will be. Social networks.
• Social interactions: maybe the party really isn’t speaking to you.
• Contact Breeds Consensus: Examples that are not in the readings: two ideas that were introduced in the 1940s was the notion of contact with other members of your group. Someone mentioned going to a place of worship. Going to mass every Sunday, you are much more likely to vote along certain lines.
• Religion can pass on political ideas.
• The Breakage Effect: If you are cross-pressured, one way to resolve it is through breakage effect. The dominant regionalism will take over: so if you live in a Republican territory you’ll breakage towards the Republicans.
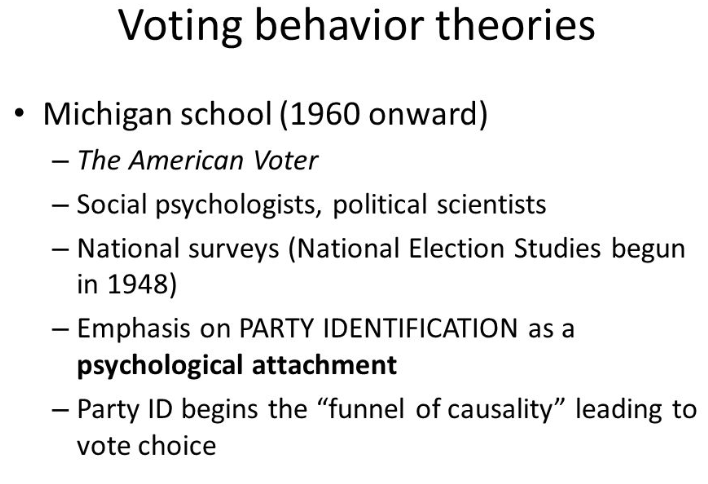
2) The Michigan Model: Socio-Psychological Model of Voting
• Supposed to fix the socio-economic model. i.e the Columbian School Model.
• 1993 from PC 143 seats down to 2 seats. Why can voting vary dramatically in the short term?
• These are the core-elements of national politics: attitudes towards, parties, issues, candidates and leaders.
• A key to dynamics: new personalities new leadership Kim Campbell vs. Mulroney.
• What to do about the deficit 93 what to do about the surplus 00.
• The Michigan saw voting as a response to psychological forces. They describe the process as a funnel of causality. The access of the funnel.
• Voting response to psychological processes (see figure 10.2)
• They look at non-political, external & exogenous factors.
We don’t ignore social background characterizes but have major additions to the Columbian Model.
Party identification: a psychological identification in a political party.
• They look at the politicization of the parents.
• You don’t have to belong to the party but you have to have a sense that you think of yourself as. Its formed earlier in life.
• It’s not immutable but it’s a resistance to change: the Conscription Crisis 1917: change in party identification. The main change can occur in the intensity of party identification (marriage, cataclysmic events).
• Women are more likely to adopt their male’s party. Less likely that men suddenly follow women’s political leaning.
• Key long-term influence on vote choice (direct influence or indirect by shaping opinions on leaders, issues).
• This model didn’t look to socio-economic background because party ID was the main factor & represents the sum of all prior influences.
• There is a long-term inertia component.
• People will normally vote for their party identification.
• Campaign communications & interpersonal discussions.
• All of the factors here effect voter choice.
• Elections Canada is trying to make it easier to vote…. technology.
• The intensity of the party’s attachment.
• Party identification formed early in life. Direction of partisanship.
• Canadian party affiliation isn’t very strong because of the federal and provincial levels.
• Short-term forces: need sufficient time to tell. 2004 sponsorship scandal hits and people abandoned the Liberals. It induces people to defect for the short-term.
• The two biggest leadership or
• Normal vote is the vote you’d expect to see if everyone voted for their party.
• Eisenhower Democrats, Reagan Democrats existed.
• Strategic Voting: isn’t as wide spread. You need to be sophisticated: people often over inflate their party’s chances.
Criticism of the Michigan Model: Psychological Model of Voting
• Evaluation of the candidate: vote for the one they like, so what have you explained? Party ID is too close to voter choice.
• Need to flesh out the funnel of causality. If party id is so important, what shapes party ID?
• Very little scope for social context.
• More overlap between the Two Models: Columbian looked at social groups and system of interaction. Both believe people have long standing predispositions. Differ in how they characterize it.
• What shapes Party ID? Why do some people vote Liberals and why are non-partisans.
The Class Voting Paradox
There is no evidence of class voting in Canada.
• Less in Canada than in the US. UK has the highest amount. No class voting in Canada. Are class cleavages declining in Europe: are social cleavages less important? They are according to Tony Blair.
• Is there any class voting in the first place: NO THERE WAS no class voting in Canada, according to Gidengil.
• This is a paradox because the assumption is that in western post-industrial democracies people should divide along class lines. Why should this matter?
• Material interests should have an influence in our politics. “politics is about who get’s what”. Material interests should play a part. We expect material circumstance to play a role in voting. Vote for party concerns about the same things as you are!!!
• We expect economics to differ between parties: we see a difference between party
• Parties think about taxation; what role should parties have in job creation.
• We expect people’s material circumstance to play some role.
• People vote for the party they are concerned about.
• Alfred found very little evidence of class voting Canada. Some scholars question Method of Research. Classified NDP, Liberals as Left. PC and Social Credit on the Right.
• Critics: say that this was misguided, should’ve focused on NDP vote as a leftist vote along. Liberal and Cons are central parties…
• When the NDP is strong the Liberal Party tends to move to the left-> Jack Layton makes the Liberals move to the left.
• Regional expressions influence voting.
• In a country was deep linguistic divisions exist: You need a party that brokers power. We are always trying to find the broker party. To exploit the medium Canadian voters.
• PC. Liberal (Bobsy Twins of Bay street): obfuscation: Parties trying to mute class cleavages then why were other countries less fortunate.
• Manual workers only slightly more likely than non-manual to vote NDP. In 1990s manual workers more likely to vote Reform and Alliance.
• The issue of sovereignty: in Quebec overwhelms.
The Relationship between Occupational Status and Vote in 2006 (outside Quebec)
• Manual workers were much more likely to vote NDP. NDP twice as likely to vote for NDP than non-manual workers (2006) Conservative 40%, 33% NDP, 21% Liberal.
• Union non-union differences
• In 2006, manual workers voted 40% Conservative, 33% NDP, 21 Liberal. Non-manual works voted 44% Conservative, 33% Liberal, 17% NDP.
• First time class cleavage was evident in NDP voting, BUT more manual workers voted for Conservative party. Could argue that the Liberals had shifted to the left in 2006 election.
• Public-sector unions.
• Economic vote: do people look at secure jobs.
• Asking about job security because it didn’t work.
• Education: the meaning of education differs across the country. Quebec CEGEP:
• People in white collar more likely to say they’re middle class, even if they are in a low paying occupation.
• Hierarchy of graduation: Marxists think of social class in terms of fundamental discontinue (interest lifestyle, culture values). Stratification approach look at income and education.
WHAT ABOUT INCOME?
• 2006 elections: Low Income NDP 23%, Libs 31%, Cons 44%
o Middle Income: 24% NDP, 27% Libs, 42% Cons
o High Income: 19% NDP, 33% Libs, 41% Cons
Education: no high school 57% likely to vote Cons, least likely to vote NDP 16%.
University educated people 35% Libs & Cons, 23% NDP.
• Own/control mean of production: control own labor power.
• Working Class = don’t control own layout power, which is blue and law level white
• New Middle Class = sell labout in return in return for a wage. But have a huge a control over own labour, autonomy (professors, knowledge intensive jobs, supervisors of labour process).
• High middle class = own means of production
Relation between occupational status and vote
• We would expect a triangular pattern, that vote share for NDP would increase from the top down. Actually more variation between the working-class itself than in high level mangers.
• Manual labour was highest NDP vote in 2006.
Unclear that there is an effective way to represent social class.
CRITICISM of Alfred’s party classification doesn’t change much. Way he classified class voting.
• Agreement that not much class voting in Canada. When conditions are right maybe we’ll have class voting.
• Evolutionary model: different cleavages hold at different points in a country’s development.
• Canada is the richest undeveloped country: we produce primary goods. Our industrial development is stunted. We export semi-processed goods. If Canada was more fully industrialized we would have class voting.
• Response is that we are a postindustrial society. No working-class culture in Canada.
• If we want to find class voting: secondary factories in Ontario are likely followed by Quebec and BC. Most damaging element for the evolutionary model: highest levels of class voting in Ontario and Quebec Where is the highest
CLASS AND NDP voting in Ontario 2006
• Very weak relationship: the more lower class you are in Ontario you voted NDP.
• Low income 27% middle income 17% high income 16%
• University 23%, post 19%, high school 17%, no high school 12%
• Union household 26%, non-union 17%
• Very little support for the evolutionary model.
• Most class voting found in Saskatchewan.
• Potential for class voting that hasn’t been realized. We would expect there to be class differences.
Income and Attitudes toward Free Enterprise and the Welfare State (2006)
• Do more to reduce the gap between rich and poor.
• No significant difference on any findings “spend more on welfare” low 29%, middle class 22%, high 20% versus “when businesses make a lot of money, everyone benefits” low 35%, middle 34%, high 45%.
• Gaps are not very big: absolute levels of agreement or disagreement are not supportive of unrealized potential for class voting. High are more likely to oppose having private hospitals.
• Improving social programmers first priority
• Oppose having private hospitals
• People who don’t get ahead should not blame the system seems balanced between the groups: False Consciousness seems crazy
• There is more mingling of neighborhoods in Canada between different economic classes than in the US or the UK.
Stephane Dion did some research on private public actors
Only 12% of 28% said they thought of themselves as working class over a 6-year period (about 3%). To people, class is a meaningless abstraction.
Langford: 2 reasons for weakness of alternative value system in Canada:
1) Nature of Canadian unions.
2) NDP’s failure to articulate a more radical vision: not hardline socialist enough.
Union membership and vote in 2006
More likely to vote NDP if members (31 NDP, 30 LIB, 34 Conservative) non-union members (17 NDP, 32 Lib, 44 Cons).
• The Unions in Canada: have focused narrowly on business concerns, wages, etc not articulating a more radical critique of the radical system.
• Union members are more skeptical of profit principle, that those who don’t get ahead are to blame, oppose private hospitals, do more to reduce rich/poor gap. No large gaps on an issue.
• Langford critical of NDP for not being more explicitly socialist in its vision. NDP is still clearly on the left. So why doesn’t it do better with it’s natural clientele? NDP is not seen as managing the economy well, so people vote for their material interest by NOT voting for the NDP. Awareness issue (had 2 low key female leaders). In 1997, NDP not in news during campaign 1 of 3 nights, idea of hopeless cases get hopeless coverage.
• Particular parties have particular strengths.
• NDP couldn’t manage them out of a paper bag.
• Awareness issue (had 2 low hey family leaders) In 1997 not in news during campaign 1 of 3 nights.
Education and Knowledge about the NDP (2006)
• NDP are the best for improving the welfare programs: less education means that less likely you are to think that NDP is best for social welfare programs) Notion of issues ownership, the NDP have not had a much issue ownership.
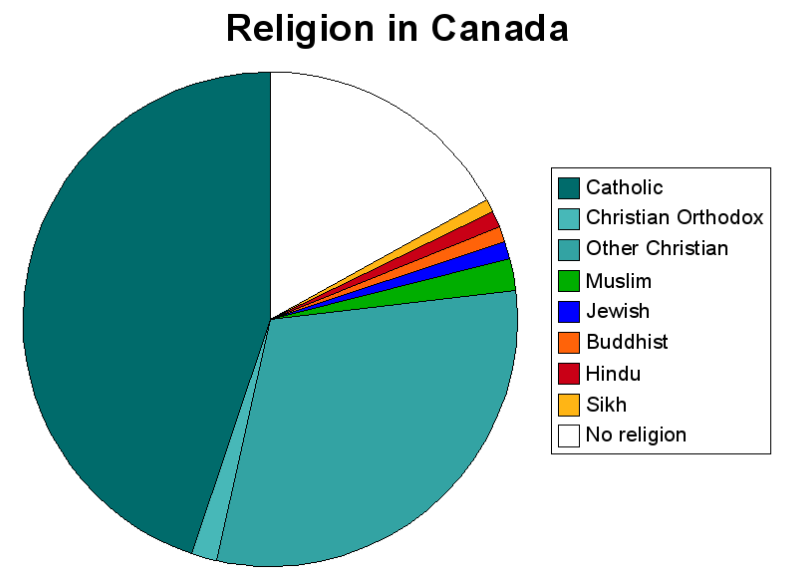
The Religious Paradox
Why is the religious cleavage so strong? Catholics vote Liberal, Protestants vote PC & Liberal.
• Canada had electoral earthquake in 93: most devastating defeat ever for an incumbent party in a western democracy: PCs reduced to 2 seats.
• Began the fight for the Right: Reform renamed Alliance. PC and Alliance merged to form the New Conservative Party. Through all of this, religious affiliation has been associated with choice of party.
• In 2004, gap narrowed. More strimingly, Protestant more likely to vote Conservative than Catholics (2.5x). Gap of 26 points.
• How different is the new Conservative Party in terms of its support base from the Alliance? The more similar it is to the Alliance, the more limited its prospects for increase support.
• Non-Christians vote Liberal. They are most likely of all to be voting Liberal.
• Secular people are more likely to vote NDP, only more likely in 2004 than before. Divide vote equally between Lib, Cons, NDP.
In 2006: Religious Affiliation and Vote Choice in the 2006 Election.
Catholics didn’t vote Liberal this time around. In 2006 the division between Protestant and Catholic is minor in 2006. This traditional voting cleavage disappeared in 2006!!!
• Liberal dominance had rested on the strength on partisans who will vote Liberal through thick and thin.
• Liberals lost 13% of the Catholic vote and the Conservative Party gained.
• Religious cleavage: Protestants vote Conservative. The action now; protestant disproportionately Conservative.
• Fundamentalists: all vote Conservative 26 points from Liberals.
The Difference between Protestants and Catholics
• Why is there a difference. Can’t generalize with Jews, Muslims and Sikhs.
• People think of Catholics are more collectivist. Protestants are more hardworking.
• Values in understanding voting behavior. People’s values and normative beliefs in behaving.
• Issues like abortion, gay marriage!
• Liberals voters shifted on the left-right continuum.
• Scholars are embarrassed about this cleavage: there are archaic cleavages and poli-scientists are less interested in religion and would like to talk about social economic cleavages.
• Religion is the Eccentric Houseguest: (Irvine 1973)
• (1) See whether religious cleavage is a surrogate for another cleavage underneath.
• A) Ethnicity/Linguistic: Francophone Quebecers are less likely to be protestant than the ROC. FC less likely to vote Cons (historically). Maybe its an ethnic vote, not religious. Implication: Q vs ROC religious cleavage should disappear.
• 2006 ROC: C & L Catholics were Equal. For various historical reasons, the Catholics never vote Conservative, 88, 84, 06 (exceptions).
• B) Social Class: Protestant are haves, Catholics are have-nots. Haves vot Conservative, Have-nots vote left. In 2006, income & Conservative vote: high-income protestant less likely to vote Conservative than low income Protestants (47% to 55%). The Religious Vote is being masked by Social Class voting. Protestants have been more likely to be haves Catholics are have-nots. People in Canadian who are haves support the party that promotes tax cuts.
Religious Affiliation, Income and the Conservative Vote in 2006 (outside Quebec):
• Low income: Catholics 37% Protests and
• Middle income:
• High income:
• Low income Catholics are the most likely to vote Liberal there isn’t a massive gap between middle and high Catholics. Low income Protestants will vote most in the Liberal Party.
• Not a religious vote but an ethnic vote: the religious cleavage should disappear. Religious affiliation and Vote Choice in the 2006 Election.
• Liberals Catholics outside of Quebec stills strong. The Catholics are split between Conservative and Liberals.
• Sovereignty trumps age, language, religion.
Religious Affiliation, Non-European Origin and the Vote in 2006:
• Liberal Catholics in Western Canada. People coming from northern Europe are protestant.
• Central Europe: Eastern Europe. Catholics.
• Newer group of likely to come from Latin American, Asia Eastern Europe = Catholic.
• Liberals were associated with opening up immigration.
• Official Multiculturalism: under the Liberals.
• Liberals helped get people immigrate.
• The older immigrant groups: would vote Conservative: Anglo-conformity: Assimilate into the Anglo-English Canadian encouraged them to vote Conservative.
• A much greater reluctance to accept accommodating French. Why can’t we be recognize the West as a founding peoples as well? They did all the hard work.
Religion Affiliation, Northern-European Origin and the Vote in 2006:
• Is there an urban rural voting is Conservative Party.
• Northern Europe: Conservative 55% protestant, Liberals 35% protestant, Liberals Catholic 35% and Cons 35% Catholic.
• Irvine declares success on the third try
Family Socialization Argument: the differences between voters choice could persist because of the family. It’s very likely that you’ll inherit their beliefs or at least their values. You probably have some religious teaching or lifestyles. Most people don’t change their religion. People tend to inherit their parents partisanship.
• People don’t mention religion BUT everyone seems to vote Conservatives and Liberals. I believe it is the breast milk of your mother dictates voting behaviour.
• This only works if your family is very politically involved, if people don’t care then argument doesn’t hold. Some parents don’t necessarily agree.
• Some people aren’t interested in politics: so people just vote on religious lines.
• Subconscious socialization.
• Irvine got it partly correct: it makes sense: but it seems that offspring misperceive parental partisanship. Sometimes the offspring get it wrong about their parents. What about parents who don’t have a political affiliation. This is so unreliable.
• Doubt about Canadian identity people change their vote and party id very easily in Canada. There is a lack of political discussion at the dinner table. How do they pass on their party identification.
Richard Johnston: 1970s: only 1/3 of Canadians inherit their parent’s partisanship.
• Intergenerational transmission doesn’t explain the religious cleavages.
• “I wonder…what about parents who realign party ID during life of children? Would child remember early age or later age? Early b/c formative years of life, when older want to form own opinions???”
• Irving found that the most successful in passing on their partisanship: Liberal parents transferring their partisanship to their kids.
• Many people forget who they voted for in the last election.
• Dick Johnston: given the process of intergenerational-transmission are weak, given the Liberal do a better hob, must be something ouside enforcing connection between being a Catholic and a Liberal: And the liberals pass on their partisanship better> Religious schooling itself, Catholics have their own school systems, expose to people who share similar beliefs.
• Johnston’s argued that there are influences in the larger Catholic community. There is an influence out side of the family.
• They’re disputes over religious schooling; another possibility is religious schooling itself: Catholics. Separate Schooling is Catholic: exposed to other schooling Catholic.
• There is a distinctive Catholic ethos that is spread.
• Private Schools are Protestant in Ontario.
• Johnston: the reproduction of Liberal Catholics has to be reinforced by larger full influence. Columbia: the two different used to describe the social behavior: there is a connection between social background and the breakage effect: voting is a group experience.
The THREE Dimensions of Religion Affecting Vote Choice:
• Belonging, Behaving Bad Believing
• 1) Belonging: your catholic, protestant you belong to that groups so you should just do it.
• 2) Behaving: the practice of faith, going to a place of worship means being exposed to religious teaching and co-religionists. More interaction more salient religion is to your life, more likely to divide along religion. Contact leads to consensus. You’re exposed to religious teachings: the more you’re interacting with your co-religious the more likely you’ll divide amongst religious lines. You behave: religion.
Personal importance of Religious and the Conservative Vote in 2006:
The difference between Protestants and Catholic vote is biggest for people who say religion is important (38 to 61), not important is hardly different.
Very important somewhat important not very important. Catholics less obsessive about religious importance.
The more salient religion is in your life.
Personal importance of Religion and the Liberal Vote in 2006:
• Very important: somewhat important: not very important.
• 3) Believing: accepting the major tenets of your faith. You have a religious understanding of the arguments and believe in your religion deeply. There is a distinctive Catholic ethos. You’d expect Catholics to oppose abortion. Catholic Church promotes social justice. Being supportive of unions, which fight for equal conditions. You favor narrowing the gap with the poor. Opposition for nuclear weapons. Social justice is about giving equal rights to people.
Religious Affiliation and Political Attitude 2006 ROC
• For 2006: on social justice: opposition to private hospitals: they only care little about welfare, and social gap. They want to cut defense spending.
• The more exposed you are to secular media; the media doesn’t cue religion. People who watch television.
• People who paid attention to the media will likely lose religious hardening.
• Catholics pay less attention to television is less likely to vote Liberal. Mainstreaming worked in 1988, 2006 (didn’t work). Catholics pay less attention more likely to vote conservative
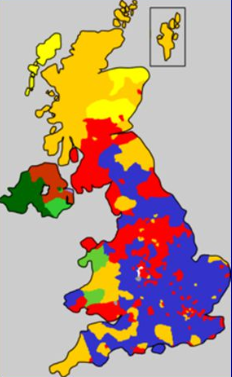
REGIONALISM and Vote Choice
Canada has divided itself along regional lines: region has become more salient in voters choice: 1993 intensified regional voting. BLC (only in Quebec) and Reform (was Canada wide but western Canada).
• 1993 region is still important.
• Ontario west gap is 20 point difference. In 2000 only one western voter ¼ in other words Ontario was ½ to vote Liberal.
• New Conservative Party of Canada more successful that the CA>
• The Alliance won twice as many votes in the West than ¼ Ontario. Huge gaps between parties.
• As the Conservative support increased.
• 2006: Liberals lost ground everywhere: 2004 dominance in Atlantic and Ontario. 2006 Conservatives finished only 2 point behind in Ontario and Atlantic Canada.
• Western Liberals were in third place behind the NDP.
• Liberals lost a 14 points in Quebec. 5 points behind the Conservatives.
• The Strategist: said there was no point in Conservative in Quebec.
• Can the Conservative hold on to the Quebec?
• NDP isn’t very regionalized except little support in Quebec.
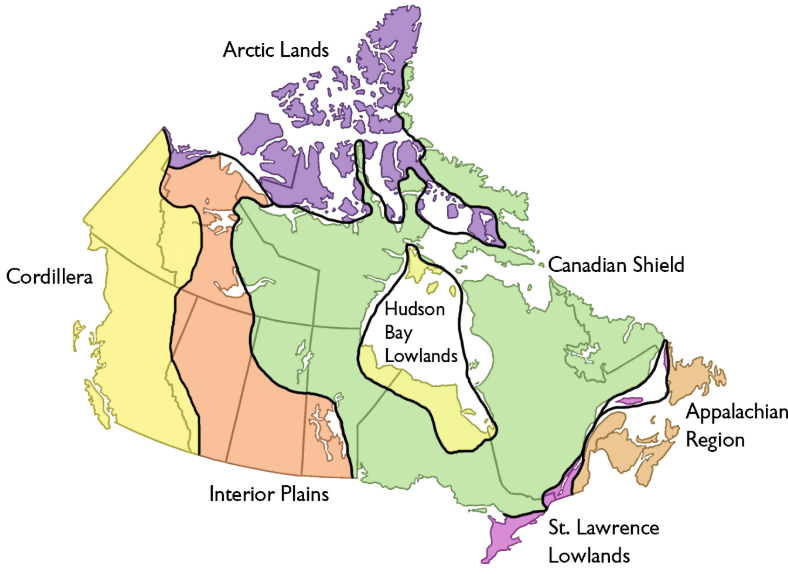
Regional Artifact Theory:
First Question: Are Regional Differences Real? Are they true? If they can’t be explained by differences in the social make-up of the regions?
• The “regional differences are really marked in other differences’: the racial makeup, the ethnic, urbanization of the region.
• 1) Regional Artifact Theory: says region only masks different social makeup. Religion, ethno-linguistic, racial, urban/rural, economic
• Example: Catholics are more likely to vote for the Liberals: more Catholics in Atlantic Canada then in Ontario. 1/5 are Catholic in Western Canada
• Ethno-linguistic divides.
• If the region: someone who has a given social characteristic shouldn’t change his or her vote in another region. So, if they are consistent throughout Canada then this isn’t regionalism? Why are people trying to explain away the regional divide. Academics are uncomfortable with it.
• What do we see when we see religious cleavages.
• Religious Affiliation and Vote Choice in 2006:
Catholics should vote the same way regardless of where they live. SO is NOT THE CASE. Catholics in Western Canada are less likely to vote Liberal: only 25% are voting liberals as Catholics. Ontario and Atlantic Canada
Protestant in Ontario and Atlantic Canada are most likely to vote Liberal than Catholics in the West.
Religious Affiliation and Vote Choice in 2006
Catholics:
• Atlantic Catholic Lib 43 Cons 25 NDP 28
• Ontario Catholic Lib 43, cons 35, ndp 12
• West Catholic Lib 25, cons 57, ndp 15
Protestant:
• At Liberal 35, Cons 49, NDP 15
• Ont: Lib 32, Cons 45, NDP 16
• West Lib 15, Cons 59, NDP 19
Politics is in a constant state of flux. Some people are anchored by social identities, so must understand this to under vote choice. Why is this useful? If you don’t understand behavior of voters you won’t win and election. Columbian model focuses on static factors, when politics is in flux.
Short term forces matter but social background and values play a role. Must understand inertia component.
• In every region, Catholics are more likely than Protestants to vote Liberal. But is this not a religious cleavage? Despite region, Catholics always more likely that Protestants to vote Liberal. Catholics are more likely to vote in the Liberal party. The Cleavage in Conservative voting: do 26 points in Atlantic Canada.
Ancestry and Vote Choice in 2006
Ontario/Northern European 2/3 vote Liberals lost votes to Conservative. In the West, 25% non-Europeans vote Libera. (in 2004, both were the same). Libs lost support of key non-European constituency.
Ontario/Non-European vote was strongly Liberal. BUT significant drop in West/Non European.
Rural/Urban and Vote Choice in 2006
At/Urban ndp 23, cons 32 lib 40
Ontario/Urban ndp 18, cons 37 lib 39
West/Urban ndp 22 cons 45 lib 21
At/Rural Lib 31 COnse 42 NDp 21
Ontario/Rural Lib 32 Cons 45, NDP 18
West/Rural Lib 10 Conserve 66 NDp 20
Big Gaps: 1997 Difference between Reform Voting: West and Ontario
1997 Difference between Liberal: West and Ontario
The Compositional Differences only explains 3.3 point in the gap (Reform and in Liberal 1.0 and compositional difference didn’t explain any difference in Atlantic Canada.)
1) Compositional differences: How much of a gap can we explain through social makeup of regions?
• Biggest difference in Reform gap voting between West and Ontario but only 3.3 points were explained. Gap between Liberal Ontario & West, 1.3 points, between Ontario and Atlantic Liberal vote, didn’t explain anything.
• Surprise by how little economic difference make a difference. Does lower income take into account lower cost of living? Is economic vote attached to provicial government instead, because strong provincial governet can extract more resources from the federal government, maybe personal vote more important in Atlantic Canada because known candidates.
• PEI highest turnout, Newfoundland has lowest turnout. Idea that people vote to balance out provincial and national governments. Also, provincial parties do nto mirror national parties.
• READ THE ARTICLE: surprise how little economic character makes a difference in Atlantic Canada. YOU’D THINK this would effect regional voting. Regional gaps: Atlantic Canada higher unemployment. Economic votes in Provincial Government. Personal vote has an influence in Canada.
• The role of partisanship in PEI.
• Region trumps religion
• Conclusion 2: Most of the differences between regions are real not artificial. It depends on where they are in the country.
What Explains this Difference If It Is Not Social Organization?
• REGIONAL GREAVANCE: Ontario is the most likely to brag about the benefits.
• West and Atlantic Canada are less likely to think their province is treated well. Explains why Liberals do poorly in the West.
• DISAFFECTIOIN with politics in general. Ready to believe that politicians would say anything to get elected. Desire to go back to the grass roots. The Prairies: populism: Canadian Political Thought: the relationship between the citizens: David Leacock wrote a book on populist thinking on the Prairies. It’s an anti-party sentiment: political parties are hierarchical institutions that prevent citizen participation. ANTI-Party parties.
• People are against politics in general. The NDp has been important to voice unhappiness on the way politics works.
PARTISAN CLIMATE: Part OF THE Liberals problem in Atlantic Canada and the West is the partisan climate: you need to have a solid core of partisans. How many partisans you’ll find in the region Another factor is the ideological climate: more partisan to the right.
• Do Liberals have more partisans given the value system, or do Conservatives have more support that’s what the partisan climate means.
The Partisan climate: Michigan School: party identification is the perfect distillation into a person’s history. Their social background influence. Party id is the perfect distillation of all these things.
• Why is the partisan climate in the West which is so anti-liberal? Historical grievances: when there are conflicts the interests of westerners get sacrificed.
Simplest Short-Cut of All: (Brendan O’Neil)
The similarity of themselves and the leader: The Western Liberal Leader John Turner: people will vote for the party lead by a westerner. All levels of sophistication.
• Regionalism: does someone’s partisanship change.
• Railroad Tariffs: Policy tariffs protected the railway tariff but it screwed the west. Western had to compete: had to pay higher costs to buy goods.
• The Western didn’t get 1930 Section 93: didn’t have jurisdiction. Peter Lougheed: the effects would not have been as devastating. NEP, CF 18 Winnipeg to Quebec.
What do attitudes sociology on policy questions?
• If you ask people how they would characterize their opinions. Alberta will tend to say they are fiscally conservative. Less spending on welfare, individualism, let the market run freely as possible. Social conservatives in Alberta.
• West: economically conservative, socially conservative, less open to diversity. Reform, and Alliance seen as ethno-centric and xenophobic (little evidence: say what? As Jerome Black!), close to radical right-wing European parties that are anti-immigration.
• Westerners are stereotyped as less open to diversity: immigration, Reform xenophobia. The reform was not driven by anti-immigration. They were similar to Radical right-wing parties in Europe.
• Quebecers too have been called anti-immigrant: don’t accommodate to diversity; Quebec is much more collectivist. Quebecers are much more socially progressive.
Region and Social Conservatism 2006:
Should not do more for women: Ont 57, West 59, Atlantic 43,
Should be difficult to get an abortion
Oppose same-sex marriage
Tougher sentences for young offenders
Support death penalty
Should scrap gun registry
The Only Big ISSUE that the West and Ontario disagree on was the gun registry.
Stereotype that Atlantic Canada is the least conservative, Atlantic Canada aren’t into gun control.
Regional and Views about the State vs. The Market 2006
• When business makes money everyone benefits (Disagree)
• Increase welfare spending
• Oppose
• Check slides.
• Quebec is the least opposed to two-tier health care. Quebecers are tied of the actual system in Quebec. The media play up what’s wrong.
Regional and Attitude toward Minorities 2006
• Do less for Quebec Q 3, Al 38, Onto 37, West 45
• Do less for racial minorities: 23% West, At 12, Q, 9%
• Reduce immigration: stereotypes don’t hold, all open.
• The Gaps in opinion across province are modest. What does differ is the Salience of Different issues: (ex; people in Ontario don’t care about accommodating Quebec, but West is made about it).
The answer: the in the aggregate the salience of different issues views matter more about Quebec. Ontario doesn’t care as much about Quebec. 1997 job creation in Quebec voted liberal. West voted for the national unity question more because different issues.
• Women were more likely to vote on the left. Men were more likely to vote for the conservatives. This pattern: is becoming increasingly common in western democracies.
US GENDER GAP is substantial: 1980 when women were less likely to vote Reagan.
• Ingelhart: Development Theory: realignment process underway: In some countries women are to the left of men. In some countries women are to the right of men. This is changing. Different countries at different points of realignment.
• There is a process of gender re-alignment. Men and Women are shifting positions: in some countries there is still a traditional gender gap. In some countries, different countries there are no difference between women and men.
• Women moving the left of men: Women and men: there theory focuses on women and changes in women’s lives.
Does Canada qualify as a case of gender realignment? When did this realignment occur?: to answer to that questions:
Evolution of Gender Gap in NDP vote, 1965-2006
• Before 1980 women less likely. 1965-3. 1979 -1. 1984 even. 1988, 1993: +2. Peak in 1997 at 6% higher. 2006 at 4%.
• Since 1997 significant gender gap in voting NDP.
• Gender realignment does seem to exist.
• Seems that modern gender gap emerged in 1997. US 1980. But must first look at other parties.
• She’s taken all the studies: when have women gone less likely NDP and then full out NDP?
• We have had a gender gap. On the other hand, in order to decide when this re-alignment began it dates back to the last ten years. The modern gender gap emerged here early and in the US.
The Evolution the Gender Gap in Liberal Vote Choice 1965-2006
• Women were more likely than men to vote Liberal from all that time dipping to 2 point 1997-06.
• Under the Liberals Trudeau’s sex appeal. Liberals aren’t really the centres left or right. Gender Gap: the emergence of the gender gap was much earlier.
• In 1997, the gender gap disappeared: the same year the gender gap opened up.
The Evolution of the Gender Gap in PC/Conservative Vote Choice 1965-2006
• Men were more likely that women in 1974.
• The Party did attract some women. Having a female leader in 1993.
1965: 2 1968: 2. 1974 -1. 79 – 4. 80 -8. 84 -3. 88 -5. 1993 +3. 97 +1. 2000 +2. 2004 -3. 2006 -5. Women leader seems to have helped attract more women’s votes. Joe Clark better with women.
• Wasn’t late 1990s to 2000 when the men left the PC and joined Alliance, so W Conservative voting should be higher?
Gender Gap in PC/Cons Vote Choice 1965-2006
• 1993: Reform -8. Pc 3. Bloc -1.
• 1997: Alliance -8. PC +1. Bloc 0.
• 2000: Alliance -10 PC 2. Bloc 2.
• 2004 Bloc 2.
• 2006 Bloc 2.
• Reform Party: women were much less likely then men to vote Reform. In 2000 as the Canadian Alliance.
• This is damaging to women and any theory that focuses on women and changes in women’s lives. This gender gap shows that men were more likely than women to move toward the right.
• Moving to the Bloc and Reform: were mobilizing people in those elections.
• More men than women moved to the right: other gender gap literature. The conceptual focus on women.
• The opening up of the gender gap gave women a lot of ammunition: it helped advance women into political parties. Women are no longer relegated that they have no chance of winning.
• People who study gender
• Women are less likely to have financial security: child bearing.
Gender and the Evolution of the NDP Vote, 1965-2006
• Women have shifted to the left in 1979. Since collapse in 1993, women more likely to move back.
• Why have men moved to the right?
Gender and Vote Choice Outside Quebec in 2006
• No difference Little gender gap Liberal Gap.
• Conservative: men 45.2% women 39.7%
• NDP 18.0 men// 23.3% women.
• Women are less knowledgeable then men.
• There are differences between women and men.
• Here are women here are men: it’s divisive. No one is just a women or a man.
• Losing support from the men in the Conservative party is possible shifting women.
• Women voted the most for Conservative.
Gender and Vote Choice in Quebec in the 2006 Election
• In Quebec, people who are more likely to vote: they are more likely to vote for the Liberal party. The gap is narrowing; the older federalists work harder.
• The Gap in Bloc Support: 47 women 36% men
• Men voted 27% for Cons.
• Liberal 22% women/men 19%
• Women live longer so there are more older federal women than men.
• Gender gap emerged in 2004: why only a gap now? Possible temporary phenomenon due to sponsorship scandal. Could be a function of women’s political knowledge (lack therefore) that Men vote NDP more because Women just don’t know about the NDP: not well known in Quebec.
• Why is there a no gender gap for separatism? Big difference between women and men is the salience of healthcare.
How to explain these gender gaps:
1 AGE: the traditional gender gap why would women have traditionally voted to the right and explain why they have been shifting to the left.
2 Confinement to the Domestic Sphere: Women less likely in the workforce in the 60s. They didn’t witness discrimination. It was expected that in the 1980s the gender gap would close once workplace participation was equal (no 60% of Women in workforce). Having children makes women more Conservative (concerned with law and order).
• Confinement to the domestic sphere, women are more religious than men. Increased divorces women are individualist. Changes of women lives.
• Far more women who are single parent.
• In the 1970s: the second wave of feminist this is when the transitional period takes off. Now the third wave: people are considering the promise of burdens for the future. In 2006: older women were less likely than younger women to vote Conservative. The Sense effect: for men: women don’t
• Women are more conservative at youth and then become 30-40 move towards women’s view.
3 Greater Religiosity: Women more religious than Men. True today as well. Vote right because they attend church thus exposed to socially conservative values. The traditional gender gap was explained by gap, confinement to the domestic sphere: women’s greater religiosity. The gap argument. The gender gap and liberal voting. Women live longer than men.
4 People More Conservative as they Age: There are older conservative women than older conservative men: older people are more conservative.
• Now increasing instability of marriage means that more women are living alone in the world. Logical that feminist movement would be a catalyst.
• Married women with lots of ties to high status likely to NDO. Women with same sex social spheres vote left.
• When women marry they tend to become more conservative. Seems to be less likely to be fiscal and more to do with moral traditionalism. Effect holds even for common law: (so do W, once married and having own children, think abortion is bad when they previously supported it?)
• Why has the gender gap disappeared on the left.
• In 2006: women who were employed voted conservative. It either doesn’t make a difference or that the employed women vote more conservative. 60% of women are employed.
• Married Women are more likely to vote Conservative: 2006
• Gidengel: women who have diverse social networks: lot of same-sex ties: Married women have a lot ties to affluent society BUT this effect can be transcended if they interact with high networth women.
• When they marry women become more conservative; something about being married that brings women closer to the right. It’s not fiscal it’s with moral traditionalism: moral rules of action.
• On surveys: some people aren’t comfortable about telling a stranger about your sexuality.
• Women are more likely than men to have socially conservative marriage.
• Reder O’Neil: feminism is pulling women in one direction.
• Women are more secular than they used to be.
• In 2006, it’s very clear that the gender gap in conservative voting but for the fact that women are more conservative than men.
• Gender Gap in support of the alliance.
• The gender gap in conservative voting has been wider.
• The best explanation is that religiosity revolves around: mental illness you’ve got some kind of mental illness: I hate school this is going to ruin your future if you don’t get help.
Modern Gender Gap Gender and Views about Feminism and Gender-Related Issues 2006
• Inglehart attributes gap to gender shift, by hypothesize that it will be value shifts and structural changes.
• Structural: objectives different in Women & Men’s lives. Women more likely to need social safety net: feminization of poverty (this argument implies that, once equal income achieve, gender gap would disappear).
• more development issues: more likely to take a stronger stance. Value shifts are a consequence of cultural changes.
• The gender gap has disappeared in the social safety net. Women are more supportive.
• Women’s attendance in University. The Cultural argument: if women and men have different values way did the timing come off? Education asks women’s to act more autonomously. Education is an important factor.
• The welfare state: services for themselves. The other part of it: women are more likely to work in the public sector.
• They are more likely to be clients in the welfare state.
• The Liberals engaged in a policy deficit reorganization.
• Women should be more skeptical that the free enterprise: if you’re on the loosing end of the trickle-down effect.
• In 2006, Women who worked for the public sector were much more likely to vote for the NDP. Men in the public sector tended to vote Liberal.
• How would I explain men moving to the right: The threat of power in women. There has a reaction to this shift. Preference for the status quo.
• There could be a welfare state backlash: there was a close connection to contributions and benefits has been eroded. You saw women benefiting more: there is a backlash. They want to see how much you put in and take out.
Gender and Vote Choice in Quebec in the 2006 Election
• Briefing Reports;
• Gender Re-Alignment: used to of the right of men. It’s not 100 % clear the difference between men and women.
• That Gender Gap: men are more likely conservative. The gender gap has reversed overtime. No massive gaps.
• Women in the public sector are more to vote NDP than men.
• Low income women NOT more likely to vote NDP than others.
• Women are more likely to vote for the NDP but more Women voted conservative than NDP. Why are women voting Conservative?
• Society has become more secular: the number of women in the work force has doubled. Women are more religious than men are.
• Distinctive experience in the workforce. Feminist consciousness, questioning of traditional gender roles, more supportive of collective provision (need programs to help deal with family responsibilities if working).
• Entering the paid workforce is a radicalizing experience.
The Welfare State Dismantlement argument point to the feminization of a poverty
• Women are less likely to have good pensions.
• Women are more likely to be clients of the welfare state. Women are more likely to use the welfare state, and to be employed by it.
• The 1993 deficit reduction and deficit elimination.
• The argument is half-right. Women who work for the public sector and more likely than women in the private sector to vote NDP.
• The Welfare State dismantles thesis doesn’t work: low-income women are not more likely to vote NDP.
• The gap has closed on the Canadian workforce. Why women would be more likely than men to vote for the NDP.
• Doesn’t work in Canada. Working Women are less likely to choose NDP more likely to vote Conservative:
• Structural and situational explanations in general do not work well to explain the gender gap.
• In statistical terms, control for these things and the gender gap gets bigger (should get smaller).
• To the extent that these explanations worked in 2006, they had contradictory effects. State employment pulled towards NDP, while religion pulled towards Conservatives. Structural Explanation help understand why the gap isn’t even wider.
• Men’s changing behavior.
• Nature of the welfare state has changed: less benefits.
• You’d expect men to be more attracted than women to the welfare state. Removal of the link between inputs and outputs in social services.
• The participation in the workforce by women has doubled.
• The traditional gender gap: women have become more unionized
• Women will move to the left after experiencing the work force. Women are in more low paying
• Employment: Women in Pink Collar jobs (sales, etc0 radicalizing effect. More supportive of collective provisions. You nee all sort of social services and programs, if you’re working and you have dependants.
• This all sounds possible, bit its not all that true in Canada. Because women were looking for pay in 2006, were less likely to choose NDP over the conservatives. Structural and situational theories do not explain the gender gap on the left.
• Gender Gap actually gets bigger.
• Public sector employment pulled women to the NDP BUT religiosity pulled women. So structural factors can’t explain the gender gap. Public sector employment pulls people to the left.
• At best the structural explanation helps us explain why there aren’t bigger gaps still. Structural and situational explanations do not work well to explain the gender gap.

Cultural Explanations
• Ingelhart: people who grew up in the 1930s and world war had to be concerned with their safety and security: material issues. Security needs were primary.
• Structural changes in society have been accompanied by shifts in cultural values, which have been accompanied by shifts in priorities.
• A) changes in cultural values and practices
• B) cultural values and practices increasingly influence people politically.
• Generations after the war grew up in security and prosperity and normative issues Post-materialist.
• Canada is an exemplary. What kind of cultural values matter in a way they didn’t.
• Women are more likely to go to university. Gidengel her professor LSE said women should not be educated at the LSE
• Women may bang-up against a ceiling. Women are less ready to accept it.
• Women used to be more active on the ground in political parties.
• Mobilizing Effects of Feminism make Women lean more to the left: focused on reproductive choice (2000 election major issue), discrimination in the workforce, representation of women in elected office.
• 1980s women movement got more women elected. Let women run in winnable ridings.
Gender and Views about Feminism and Gender-Related Issues 2006
• Sympathetic: 60 women, 58 Men
• Should do more for Women: Women 48, 38 Men
• Favour equal candidates for political parties gender-wise: 23 Women, 12 Men
• Society Better if Women Stayed Home: Women 41, Men 35
• How do we explain that Women seem to have more traditional definition of gender roles? (bigger than regional differences often). Women part-time versus full-time, and both working and raising children so identify with homemaker role, and working not so great.
Socialized to think responsibility to care for kids. Want to work and enjoy independence, but not sufficient child-care facilities.
Gender and Views about moral traditionalism 2006 (thermometer scale)
Positively view homosexuals 60 w, 48 m
Oppose same sex marriage 29 w, 39 m (minority for both W & M)
Should be Difficult to get abortion 31 w, 31 m
• Representation of women in elected office. Why would it not drive a wag between women and men.
• Conceptual focus to men: Why have men being pushed to the right. Some men prefer gender relations today. And being active in the lives. There is a suggestion that some men will resent their gender roles. Men’s position into eh private sphere was challenged by feminism.
• There isn’t much evidence about a feminist backlash.
• Society would be better off if more women stayed home: women (43%) men (35%)
• Different types of feminism: Are we talking about liberal equality of opportunity or are we talking about affirmative action. Many men are welcoming the equality of opportunity, but there could be a backlash.
Gender and Views about free enterprise 2006
All Benefit when business rich 35 w, m 44
Blame self for not getting ahead 59 w, 66 m
Jobless should move to jobs 57 w, 66 m
Let private sector create jobs w 31, m 38
• Childhood socialization. The theoretical underpinnings called in a different voice. Maybe men and women have different reasoning.
• Carol Gilligan Men when questioned about moral reasoning: rights of individuals involved. Women: the responsibilities and friendship.
• Men and women reason differently in moral methods. Women would be more skeptical of the free market institution. Readier to help the needy. Doesn’t this sound like the welfare dismantlement thesis. Gilligan isn’t crazy there is something to it.
• Women are more skeptical of free enterprise and the trickle-down theory. Women are less likely to get ahead.
The Welfare System: social welfare is the most important issue. Women are more willing to close the gap between rich and poor. There is a substantial degree of support.
• Social welfare hasn’t figured in as a key issue: health care is most important; for men it’s corruption.
• Men approached Free Trade as an Economic and Women were about social issues there was a 16 point gap shaped by the need to open markets. Women viewed the agreement about the strong social safety net. These differences could be explained with income gaps. Women were more skeptical of competition. Women want inclusiveness doesn’t like competition. Women were supportive of the welfare state.
• According to Gilligan: women see society as a web. The women see agrees ion as a failure of aggression.
• They are more concerned about violence and the use of force. Differences in adult roles.
Brenda O’Neil “Sugar and Spice” and childhood socialization: institution of family exerts powerful influence on people as a child. Media society, school reinforces role of women as self-sacrificing, caring. Points to childhood socialization. Institutions like motherhood and the family are so strong, they exert a powerful influence on use when we’re very young.
• Even women who choose not to have children are still socialized: like schools grade one, two three are teachers.
Gendered Subcultures:
difference between women and men they inhabit different political worlds. She’s on stronger grounds. Women tend to be more interested in grass roots community.
• There is a normative overtone with women: sugar and spice and all things nice.
• Women are anti-immigration than men.
• There is a timing issues: the Gilligan argument: nothing has changed women have been socialized into these roles: parents are trying to mitigate. The gender gaps still exist.
• Women need more autonomy to express their differences and that they are psychological dependent
Views about welfare system 2006
Social welfare most impt issue
Do more to reduce rich poor gap
Increase welfare
Increase social housing 48, 44
Views about healthcare
Most impt: 50, 32
Increase spending: 82, 71
Oopose private hospitals 48 42
Do not allow ppl to pay: 54 47
Taxes, corruption, health, envr: men chose tax, w chose healthcare
-1995 study by Gidengil free trade analysis: m view it as an economic issue, w as a social issue. More skeptical of market arguments, of virtues of competition (involves losers), more supportive of welfare state

Crime and Punishment 2006
tougher on young offenders 47, 51
want death penalty 33, 46
oppose gun control 30, 46
scrap gun registry 52, 65
more defense spending 37, 49
-w more opposed to use of force
-adult socialization: w have children, this socializes w and gives rise ot maternal thinking. More likely then to feel compassion for needy ppl, concerned w violence. So could explain in terms of diff in adult roles.
• Reading widely, discern the main lines of argument. Enter into a debate and build up and argument for why one side is more plausible. Where can we find this literature? (10-12pages). The twist at the end: relate it to the implications of the party in the region. Why does this really matter? Does it tell us something useful or insightful. The part that you draw out the implications should be the 2 pages. The focus of the paper is the critical synthesis of some body of literature. Do people vote on the same issues? Ideology: The role of the leader evaluation and voter choice. Certainly be going far beyond the reading: academic literature. MUST refer to literature. How many sources?
• Social cleavages in BC. Class politics BC is more salient.
Ideological Thinking in Canada? IS IT Possible?
• Do Canadians structure their thinking about politics in ideologically coherent ways? Why does it matter? Why should we care? What are the implications of a citizenry that does organize their thinking. With a polarized electorate then there won’t have parties that compete for the centre: moderate voters.
• Ideological/class cleavages might be good because would reduce language and regional cleavages regional brokerage and that’s why we don’t ideological cleavages.
• If people do understand that politics is structured along ideological lines they can make more sense of politics and be more effective political actors. Think through individual issues: or alternatively, not think about issues because automatically filter through left/right ideology. Some people aren’t able to engage in the discourse because they don’t understand the right versus the left. People don’t understand other parties.
• Some people were trapped in an ideological past. Does the article say that people understood the right more than the left.
• The extent to which people understand these terms has influenced the left right scale. 7 point scales from leftwing to right wing. They were asked to place their ideal party. There were 13 items: powerful, honest, dishonest, good, bad, left wing, right wing. They wanted to build a median image of each of the political parties at the time.
• Some of the strange results; people didn’t want to answer the ideological discussion. Either people didn’t understand the term but they didn’t know how they could label the parties. They didn’t answer. Those who did answer, answered in ways that were puzzling: they placed their parties further to the right then did people who identified the Conservatives. NDP identifiers would place NDP more to the right. WOW!!???
• Every parties own identifiers placed their own identity right of centre. NDP was a little bit a little right of centre. Every party including the NDP being perceived as right wing was more important than being perceived as left wing. People simultaneously received it Right Wing: each party would receive most votes that see them as right wing and for the working class. It seemed that there was no left/right thinking.
• The problem was the people were consistent (not randomly answering). You saw parties going right wing and for the working class.
• How can we explain this pattern: what determines whether they are centre left or centre right. Some people will give warmer scores overall. Academics debate where to place the Liberal Party.
• People who are working class want to maximize and support
• The Author explained that these patterns didn’t understand the terminology. Provide survey researchers you can really pick that you are straining to answer questions. People are forced to produce the answer: people didn’t understand but they attached their understanding to be on the right. Right is positive. Left is satanic: it isn’t actually right (correct). “Right means: honest, principle, correct”.
Ron Lambert: argued that the low level of ideological thinning was a methodological artifact.
• Power powerful, honest, dishonest, dull and inspirit. You had thirteen bipolar scales. They had 13 different scales. A scale of 1 to 7. They were asked to make 65 judgments. We get people not thinking about what they are saying. If they’ve always had dull and exciting they are going to keep on getting the higher numbers in the party. Exciting: they stopped thinking and give the number they had been given. They made the cautious answer.
• Because the scales were simple to understand. People were reluctant to say, “I don’t know what right wing and left wing means”. They had all these scales and used to give right wing numbers. The other effects of having easily understood terms what do you do but you don’t understand.
• You can’t infer meaning. What would the strategy. Answer neutrally. Answer in the middle. So the safe response is in the centre. Problem of Reliability: people answer differently depending on day.
• Comparability: different people don’t anwer the same, on same scale. Some cluster, others use all numbers.
Lambert went on to the 1979 election: he concluded that there was evidence of left right thinking> there were sizable pockets of left right problem.
• What you really need was a question what does this term mean. Lambert was one of the principles of 1984. They tried to elicit was what does the term left and right mean to you? Then the affect of the terms: they looked at the attitudes about people’s self-placements: did they take positions on the left that you would expect people to take on the right? Did people use the terms consistent with their party’s identification.
• Lambert was impressed the majority of respondents responded quite sensibly. The over whelming majority.
• One journalist was pretty impressed: many people cite the argument more favorably. You glasses half empty. 60% of people said they used left right terms but only 40% of people provided definitions. The overwhelming majority of respondents who attempted to respond were not off the map but they weren’t eloquent.
• There is a personal vote: only 6% factor in the local member over and above these considerations.
• Only 40% were willing to give out a definitions: some people felt intimidated. Some of the definitions were merely half. Some of the definitions were merely leaders: if you were able to look at Stanfield.
• People’s positions on the right wing issues: In 1984: data. Would you expect to find people more comfortable. Unite the Right there is more of a difference. In 1984: left-right tems on the election.
• There was a lot of uniting the right in 1997. People are less likely to read a newspaper. People rely on television coverage. Even on the basis. Civic education: people do understand in their own way.
• Does it matter why do people need this knowledge to be effective citizens. The problem it is harder to express needs and wants. “Reform” its RREEEFFFOORRRMMMMM
• Willingness to Rate Political parties and Self as Left, Right or Centre (percentage providing a rating)
• Self 54%
• Liberal 58%
• Alliance 52%
• PC 52%
• NDP 46%
• BLOC 38%
• ONLY HALF WERE able to place the Alliance.
• 2/5 people placed no party. ¼ placed all 5.
Number of Parties Rated:
• None 39%
• One 61%
• 67% Two parties
• Three 53%
• Four 45%
• Five 27%
Where people placed the Parties: NDP 69% anchoring the left, had the Alliance anchoring the Right. The PC was to put the Conservatives on the Right. People would anchor the Liberals in the Centre. The Bloc is between the NDP and the Liberals.
• What percentage of people factor in the right. Barely half the people will place the NDP. 46% of the people rate the NDP. Barely the 3rd of Canadian rated them on the left.
• .52, the fight for the right, how many people lace the conservatives on the right.
• Only 38% of people rate the Bloc on the left. There is evidence of left right thinking.
• Centrist Canadian Voters: only 56% place themselves in the Centre.
• Does this effect people’s choice of party.
• We are only looking at half the electorate: the Alliance attracted its natural constituency. The Alliance: only 14% of people were on the right. BUT they got 61% of that vote. The PC got more people from the centre than they did people on the right. There were more people on left.
• The Second Choice was the not the Alliance.
Left-Right Self-Placement and Vote Choice (outside Quebec) 2004.
• Conservatives like the Alliance before them. They did better than the Alliance in increasing the centre vote. Able to pick up a moderate centrist voters.
• The NDP did better in 2004: their share of the left vote did better on the right.
• The NDP double their vote form the Centre. it could be the sponsorship scandal. The Liberals did better with voters on the right.
• Why aren’t the differences aren’t sharper: they don’t understand the terminology…Strategy voting: wanted to stop the Conservatives. Some one this may reflect. What’s the best way to defeat the Conservatives. There isn’t smooch strategy voting.
• People define themselves in different ways.
• The assignment: bear in mind: the bulk of the paper is synthesis of literature on the subject.
• Last Time: Ideology
Left-right self-placement and Vote Choice (outside Quebec) 2004
• Left-Right Self-Placement and Fiscal/Economic Priorities (2000)
• A quarter of people on the right thought we should be improving social welfare. Those we should be cutting taxes: So some people might be using left/right placements you have to wonder about some of the patterns.
Social issues Salience (2000): fighting crime is important: fight crime 48 L, 69 C, 74 R. Traditional family values 34 L, 47 C, 51 R. Environment 67 L, 55 C, 52 R.
• Is The Environment Policy: it’s not a left-right divide. People on the left and right: they differ on what they consider to be important.
• People on the Right are more likely to provide private hospitals.
• What are the criticisms about using the left right terms: some people see it as academic. Some people don’t think about ideology and focus on concrete solutions that pursued those people.
• There are more than just left-right ideology.
• There are two left right dimensions. What about people who aren’t political but want to be able to put themselves on the spectrum.
Ideology is a yard stick but the argument against using it as such is that the left right divide is too restrictive.
• The old left right dimension: market versus state. Old left and skeptical of free enterprise. The government should intervene.
• In Canada being on the left over the right has entailed opposition to closer ties with the US less continentalist: this reflects that hate of US weaker social safety net.
• New Left-Right: lifestyle, law and order, diversity, family values, sexual orientations. Right wings are more tradition, get tough on crime: put 10 year olds in jail!
• Fundamental beliefs and values: did they go together in ways that were consistent with the left-right distinction.
• We put people into categories: did people’s fundamental beliefs go together in coherent ways.
• Most people don’t posses true attitudes: some people answer randomly. You can’t predict attitudes: but different may put their attitudes together in different ways.
• These basic dimensions encapsulate people. These beliefs and values serve as a template.
• If a new issue comes a long they will evaluate the new leader on basic beliefs. So someone isn’t open to diverse lifestyles they are going to like a leader who stands for those things. When a new issue comes along those people react negatively to private hospitals. The represent something more enduring.
• There are certain beliefs that go together. They correlate highly. Canadians do have coherently structure. We made a distinction between basic outlooks and communal outlooks.
Communal Orientations:
view Canada as different to the US.
• There are 3 orientations: IN Quebec: it was a no brainer:
• 1) The most important orientation views about sovereignty has influenced. VERY little else matters after the Bloc Quebecois.
• Reform broke through by advocating a tougher line on Quebec. Prior to 1993, they plot voters in a two-dimensional space. A lot of voters want to get tougher on Quebec and broke through on that fact.
• 1997 Reform’s position on Quebec was a handicap: Manning was a threat to national unity for their views about Quebec. “Get in the family or leave, Quebec!”
• The Alliance did distance itself on being too tough on Quebec in 2000.
• In 2004 and 2006, views about accommodating Quebec returned. People who want to stick it to Quebec, Conservatives are trying to build support for the Quebec section.
• People who wanted to be hard on Quebec and voted Conservative.
2) People’s orientation on outgroups (aboriginals, racial minorities): don’t want accommodate other groups. Quebec was time bound, there was a positive view about accommodating racial minorities but its view of aboriginals. OKA crisis.
3) Continentalism Orientations: the Canada/US FTA dimension disappeared. In 2000, it was not a factor. Continentalism: was important in separating Conservative voters and non-Liberal/Non-NDP.
4) The Basic Outlook: was cynicism. Politicians lie and make promises they have no intention of keeping. The Reform served as a lightning rod for political disaffection. People are not as disaffected as they were ten years ago. Reform was able to tap into that outlet for anti-party sentiment: Social Credit legacy.
5) The protest vote in 2004-2006 split between the NDP and Conservatives. The NDP was not able to play it’s role that the cynicism party. The protest vote was the Bloc Quebecois over an above soveringyt and regional alienation. The populist sentiment in the Bloc Quebecois was important.
The two dimension are most important: free enterprise and moral tradition.
• People’s orientation to the profit system; does the money trickle down economics to the poor.
• Moral traditionalism, views about women’s place: family values. Both senses of beliefs went together within Quebec. The two dimensions comprise the dimensions between Quebec. There is potential in Quebec for these values but are overwhelmed by sovereignty.
• There is a link between issue positions: voters for each party can be lined up along a single dimension. They anchored
• The only one that was not distinctive was based on free-enterprise. Difference between Liberal voters: they were all towards the right there are only NDP voters on the left.
• The average position of voters for NDP and Reform. Liberals Bloc is between the Liberal and the NDP
• There was something to the idea that the Liberal and Conservative brokerage parties.
• The PC voters were just to right of Liberal voters. PC voters were much closer to the Liberals than they were to reform or alliance. That’s why the alliance was able to grow.
• The last piece of evidence: knowing people’s place on the left-right dimension: we found that it did. People’s fundamental beliefs to correspond to the left right dimensions.
Old and New LR dimension help explain vote choice: Level of coherent ideological thinking is higher than thought. See where people place simultaneously on these two dimensions. People twice as likely to be L on social (new dimension_ than old More polarized on new.
• I want to see where people place simultaneously between the spectrum
• The Bloc Quebecois doesn’t want to take health on the federal level. They regard health of provincial jurisdiction.
Economic Liberalism-Conservatism and Fiscal Priorities.
• The gradient is less steep than with self-placement.
• Old LE and policy attitudes: researcher placement does allow some degree of predictive capacity. Gradients are steeper.
• The only way to tell if there is causation rather than correlation is to talk to people about the way they think about politics.
• In Canada, there usually aren’t large difference in public opinion, which makes this type of research more difficult.
• New LR is harder to identify but researcher classify everyone, whereas self-placement only applies to half the people.
• Ideology mediates the connection between social background characteristics.
Party ID: much as people might identify with a religions, ethnic group.
• A salient social group is like being political.
• Parties stand for relatively stable ideals: religion is relatively stable.
• Party ID as a long-term component. Issues come and go, as do leader: Parties endure.
• There is a psychological attachment to a political party. This has implications on how you measure it. This depends on people’s self-identification. You have to ask people how they think of themselves. Their self-perception is central.
• The classic question has been asked until 1988. “Thinking federal politics do you think of yourself as a Liberal, Conservative or NDP or what.”
• If someone was a liberal how do you feel. Then you follow-up how strongly you feel. Do you fell closer to one of the political parties. There are people who say they leaners.
• Party identification was established in early childhood. Just like being a Catholic you grow up as thinking yourself as something that you grow into.
• Party ID can change but in the original model can include You move to Ottawa and become a Liberal.
• Marriage can affect party id: the women changes her partisanship. In Canada, people who are married are conservative. The relationship changes political views.
• Personal focuses can change party id.
• On the other hand, you can see whole sale change called realignment.
• Party id: As we grow older our party ties strengthen. We may grow-up feeling we are conservative.
• Which way does influence go? Are kids socialized into a person. Does the party have a socializing aspect. It molds people’s views.
• Party ID strengthens with time.
• Other things being equal, you’ll identify with the party will you be predisposed to vote Liberal. In a normal election most people will vote their party id.
• There is an indirect link, by effecting people position on the issues.
• There is an effect via, positions on the issues and evaluations of the leaders. If you identify the leader; you are more likely to identify with the leaders.
• Party identification serves as a screening function. They react through the filter of their party attachment. If you id with the incumbent party: you will evaluate economic performance. You may be more likely to support the government
• What’s that chances of winning they systematically over estimate their parties chance.
• People pay more attention to between about the party of their loyalty.
• People who were Reforms created the negative stories as okay.
• How do you affect people’s social background.
• In the Michigan Model: a persons vote in a given election is decided by a) long stand disposition to favor the party and b) the short-term forces of that particular election.
• The short-term focus: the issues, the presidential candidates, the local candidates, there are short-term forces that they deflect someone from their usual party vote. A Liberal Partisan in the 2006 election.
• A liberal identifier: they didn’t like the sponsorship. Or the Liberals vote for Chretienite. Catholics are Liberal voting in 2006 but still think of themselves as Liberals.
• If people vote along aligned there would be much explanation. A protestant church. If people always voted in the line with the party id, it would be a boring concept. It should help predict but it should predict too well.
• Party ID predicts votes too well: so do people have other ID
• THE KEY POINT ABOUT ID: even if they vote for another party they must retain their identification. Did those people who were Liberal partisan ALSO change their party id. Even if some defects do they retain their sense of being a liberal.
• The only change that was anticipated: was a change of intensity. The stronger party becomes: the more constaining the filter will be.
• Europe is not interested in party identification. BUT Canada is whishwashy about party id. It’s too close to voters choice. In western Europe people would prefer to use left rights.
• Would you expect that work in the US. Is this just an American theory.
• A Concept that only works in the US is a two-party system.
• The stronger the party id, the more likely people are to simply not vote when they are angry about an issue (sponsorship scandal).
• Catholics and non-european are more likely Liberal partisans. BUT there is nothing. Black vote is democrat.
• Strong regionalism don’t necessarily have
• The democratic party used to be able white southerners and then turned into the civil right party.
• We have brokerage parties that are trying to bridge people they are trying to exploit cleavages.
Institutional Arrangement in Canada: What about institutional arrangements? What doesn’t exist here? Presidential system is more polarizing. The Presidential System: the presidential candidate is a person apart from the party: people can vote from that candidate.
• In our system we vote for the local candidate, but if we vote for a candidate who is of another party we don’t feel good about. Eisenhower democratics.
• US primaries: people are required to label themselves Democrat or Republic. Americans have multiple of ballots: they may have to vote for a long list of positions. State treasurers…etc
• So if you’re trying to decide? The party label is a great short-cut. Part of the voting mechanism. You can vote a straight ticket.
• If you have multiple ballots and you might go down the list: you might know some person.
• Municipal Politics in Canada: we don’t have Bloc running in the provinces.
• Municipal elections are random and focus on different issues. Provinces elections is different that could help you to reinforce your sense of the parties.
• Something else in Canada, during the Trudeau years you don’t have term limitations.
• When you ask someone in the US why you support someone they’ll see the talk about the party.
• You ask people here about the Liberals they talk about Paul Martin.
TEXTBOOK Theory: The concept does not apply in Canada
• A similar conclusion has been reached in Europe. The doubts about party identification were led by Miesel. The 1965-1968 were modeled on the Michigan Studies. They posed the question in Canada. The party identification: is almost inapplicable in Canada.
1974, 1979, 1980 Canadian election studies: heavily influence by Michigan Model didn’t pay much attention to the social background.
Damning part of their evidence came from their panel (re-interviewing people from previous election). Panel data is good because can track the same people, otherwise have to rely on peoples recall. Recall tends to be skewed towards current support. In those 3 elections, 40% of people changed party id. Switched from one to the other, or switched from ID to not id, or from not id to ID. Another 40% retained the same party id and vote choice. Among people who changed vote, party id traveled with them (not supposed to happen). 11% of the panel consisted of voters who changed their vote but kept their party id (as theory predicted).
-from 1984-88 14% kept id, changed vote. 1988-93: 17%. (odd, because with new parties you’d expect new party id).
-outcome of this is that stable party id with changing vote does not apply in Canada.
Harold Clark et al. ended up modifying the concept of party id.
-intensity, stability, flexibility: used this to classify everyone as a durable or flexible partisan.
-durable: fairly strong id, stable across time, and consistent id across federal and provincial levels. Most of them always voted for the same party. Strong, stable consistent.
-basically flexible partisans are everyone else: either unstable in attachment across time; inconsistent across levels (not the same party fed and prov, or 1 part fed and no party prov); weak partisan. Fail any one of 3 tests, flexible partisan. Flexible partisans are also those who indicated no party ID at a federal level (argued that there were ppl who were caught in the moment of transition between party ids). 63% of ppl flexible partisans. By 1988 and 1993, 75% were flexible. Flexible were more likely to change vote, more susceptible to short term forces.
Consistency; either a durable partisan or a flexible partisan: durable partisans have a very strong identification.
• Flexible partisans were either unstable across time or inconsistent across levels of government or they identified with one party provincially and no party provincially. People who were flexible and were moving with their way to changing they id.
• Durable partisans tend to have a standing position and flexible people are more likely to be interested. Think about the party id questions. For you usually think of yourself to federal party: NDP, Liberal and Conservative: why is it a poor question.
Party ID
Can we reformulate notion of partisanship to fit the case better? Durable partisan identify very/fairly strongly, stable party ID across time, same party at federal and provincial level. Flexible partisans were those who failed any of those criteria, or who replied none. The theory was that “none” were in transition from on party to another.
-what do we think of their reformulation?
-why not non-partisan category?
-federal/provincial parties are not the same. Strong criteria, hard to defend. Elections take place at different times, federally and provincially.
-theory that Canadians balance their votes by voting for a different party federally and provincially?
-issues dominating fed and provincial elections are not the same
-in a multi party system, common for people to feel warmly about more than one party, and feel negatively about only 1 party.
-parties themselves do not have strong ties between federal and provincial levels (Liberals are the least integrated). Not much movement from provincial to federal wings.
-parties with the same name do not stand for the same thing.
-BC has many split identifiers. 1978 prov, 1979 fed. 49% of PC identifiers were split. 18% identified at one level but not the other. Split identifier were no more likely to switch votes in a given pair of election than people with consistent partisanship. What mattered was not consistency, but intensity of feeling. (study)
Textbook theory of party ID in Canada:
- many Canadians have flexible ties. May not be saying anything more than the way they just voted.
- Party ID travels with the vote.
- Intergenerational transmission tends to be weak in Canada. Liberals somewhat of an exception (is this bc Liberal is most consistent party?).
- Study by Richard Johnston on intensity. (original idea is that ID grows stronger as ppl age). Over the typical life cycle from 18-75 the average gain in intensity was .33 on a 4 point scale. Very small.
-Gidengil: classic Michigan concepting does have applicability in Canada, previous studies underestimate partisanship.
- many Canadians do lack meaningful attachment. Many do have a meaningful attachment. The non/weak partisans are up for grabs, the strong partisans must be mobilized.
- when party id backed up by something more meaningful, like sovereignty, tends to stick better.
- Clark et al. notion of flexible partisanship is a very powerful one. Argued that at aggregate level there was much stability, but this masked individual volatility. If volatility comes together, party system will implode.
- Gidengil thinks they overestimate party flexibility. Deeper problem relating to the way party ID is measured: “none” is not given as an option. “or what” is not something people want to choose. Many people name a party because they were encouraged to name a party. People name the party they will vote for. Party id made to appear more unstable than it is because none wasn’t an option.
-Richard Johnston study: 1988 “none” added as an option. Proportion of “none” increased, # of party identifiers went down. Still didn’t know if party IDers were stablers. In 2004-2006 had a panel: why were these elections ideal?
-same parties. (same leaders, though this is negative)
-same issues to a certain extent (sponsorship scandal). If ppl remain liberal partisans despite voting for another party to punish liberals, then proof of party id.
Change in distribution of party ID 2004-2006
-very little change in other groups. Decrease in people who answered none from 2004 pre to post election. Liberals stayed the same. Cons went up, mostly from “none”s. why can aggregate distribution be misleading? Can be movement between parties that cancels each other out.
Number of times respondents repeated their 2004 campaign response
-only 2/3 of liberals repeat ID 3 times. NDP 55%. Cons 70%. Bloc 80%. Few people identifying with minor parties were likely to give the same answer. 1/3 of people repeatedly said they were non partisans.
-among very strong id, 84% kept same. Fairly strongly 64%. Not very strongly 45%.
-people who didn’t answer the same were as likely to say none as they were to say another party. Only 18% named another party. 75% only ever named one party or said none.
-half of people interviewed qualified as stable partisans. Same party id along all 4 waves. This is much stronger than Clark’s findings, reflective of the wording of the question. 18% of people switch at least once. ¼ gave no id at least once, but never switched. 9% always said none.
-if add these people up, there are 1/3 of people with no attachment to a party.
-where do people go when they switch parties? More go to none than to other parties. Tend to switch to adjacent parties on the left-right line.
-is party id traveling with vote? In Michigan conception, vote is a product of their interaction between party id and forces peculiar to a particular election. What is key is that they retain party id regardless of who they vote for.
Campaign party id versus reported vote
-close correlation between party id and reported vote, except in minor parties where ppl don’t vote as much as their id.
-people who didn’t vote not included.
-liberal identifiers least likely to vote for party, probably because of sponsorship and “team martin”. In 2006, 1/3 of liberal IDers didn’t vote liberal
-NDP often vote Lib, strategic vote.
-don’t want correspondence between vote and ID to be too close.
-if people ID with party of right and transfer allegiance, makes sense to add 2000 PC and Alliance figures together and get 2004 Cons figures.
-crucial test to judge if ID is meaningful is if it travels with the vote, or stays meaningful. About 15% in 2004/2006 retained party ID but changed vote, which is more than the 5% who changed ID and vote. 5% also changed ID, but voted the same.
-% liberals who voted against their party changed by 6 points.
-party id in Canada behaved the way it should in the face of a powerful short term force. Liberal partisans voted against their party but retained ID.
Party ID and Voting Behaviour (2006)
-leaners (people who have no id, but feel closer to one) closely vote for the one they named. Probably because no id and pushed to name a party
-85% of very strong id voted for party. 5% abstain. 10% other party.
Party ID and ratings of party and leader (2006)
-shouldn’t be too close.
-party id serves as a filter for people to judge party and leaders.
• Social Background, Partisanship, economy, non voting on age. It’s not just a cut and paste. You need to think through how it will play in the upcoming election.
• Need to have a draft of the project ahead of the presentation. You have a chance to make changes and to fill in gaps. Tell me what you’ve found. You need to tel Gidengil about information.
Do Canadians Vote with their Pocketbooks?
• The Economy and Economic Voting: the notion of economic voting sounds straight-forward and plausible. It’s the Economy, Stupid is the basic summation. If they are doing well they will vote for the incumbent government.
• People engage in a reward and punish calculus. Am I better off? IF the answer is NO, they vote the incumbent out of office.
• Election Day is Judgment Day and dole out rewards and meet out punishments.
• The Economic Voting Model has its’ roots in rational choice theory. Economic voting is actually very complex. The issues: what the parties are doing, how competent they will be. Take into account strategic considerations.
• Have to take into account of group loyalties, partisan loyalties. Basic beliefs and core values. It’s a very complicated.
• People are cognitive. They look for rational short-cuts, something that will enable you to make the correct decisions, without investing a lot of time and effort.
• Politics is not salient in people’s lives. Most ridings the vote is nile.
Problem 1) Economic Conditions and Vote Choice:
the first assumption so the political universe shrinks down to one salient political object is the incumbent party.
• Voters believe that they have some responsibility for their own wellbeing.
• You may believe that you’ll do even better with a different party in power.
• The US focus, it’s a no brainer, if you are not happy with party in power: there is a two party option.
• In Canada, it’s not such an effective short-cut. If you’re unhappy with the incumbent. Who do you choose from?
• Focusing on the incumbent, makes sense, they can scrutinize the incumbent for the rational shortcut. But it goes so far to have to deal with other shortcuts.
• Some political parties own an issue they are good at dealing with issues or the NDP have the real liability of the fiscal irresponsibilities.
• Parties on the right as seen as very good with the economy. There is a problem when you focus on the incumbent parties.
Problem 2) The Model Assumes that People Vote Retrospectively:
they vote on past economic performance. Retrospective judgments are more important about the past judgments.
• Retrospectively but short-term. And also media: influences the economy and when the economy isn’t important disappears. The economy the economy is still doing well. Media frame a negative focus.
• A voter ought to make a future oriented act certainly when sizing up the incumbent.
• Prospective evaluations you now have to decide which of the opposition parties you have to vote for. You have to ask will you be better off
• You care about the political business cycle; the incumbent parties will manipulate the fiscal and levers in the short term.
• When they announce the elections. The idea is that if people are voting retrospectively they will be easier to make sure that things are doing as well as they can right before the election.
• If voters are looking ahead they need to have the wit to realize that it is manipulation.
• There is retrospective and prospective voting.
• Another questions about who does retrospective and prospective analysis. Bankers vote retrospectively and workers prospectively
• Is this a rational shortcut. What kinds of policy was the government pursuing. The only way policies are judged is by the outcome. You assume that the government must be pursuing.
• Short-term benefiting from a high level of spending.
• What about the election focus. There is an assumption on material self-interest.
• They only vote materially: get higher or lower on economic voters.
• IF you are being told better government intervenes the least.
• A rational short-cut; it could be sheer luck. Maybe they got lucky. Maybe their policies have nothing to do with how the economy is going. May it would have been better: you may be helping the government for the bad luck for being in power when things are going badly.
• Which level of government holds them accountable. Economic voting would be weaker with multilevel government the burden on governments is heavier. Who should be punished who should be blamed.
• They are doing it in a context where there is a strong incentive to shift blame.
• We have done limited work on attributions of responsibility. If varies depending on the province.
• There are second level elections: European elections you don’t punish the incumbent but you send them a message in the sub-national elections.
Problem 3) Models assumes that voters are even handed.
Voters are equally ready to reward or punish: this is simply not true. Just as likely to reward for good time and bad times. This is not true empirically that they are more inclined to reward.
• Due to the media: the economy is more salient when the economy is bad. Issue of bad economics people are economically happy.
• Bad economic times are more photogenic. Makes for great television news. It’s a good photo times. Graphs, you could put up a graph and show unemployment has gone up. News values: it’s not the media; they want to maximize audience entertainment. News values that encourage values.
• Growth is less pronounced when the drop of growth is less visible.
• Other issues become salient when economy is doing well.
• People expect the government to manage the economy so why reward your government. You don’t need to reward them for something they are supposed to do. More fashionable and easier to hate all politicians than to say that you like them. “Old PEI saying ‘You don’t vote politicians in, you vote them out’.
• Clarke and Kornberg: the more positive state of the national economy. And it’s the governments fault to blame and praise.
• People expect the government to manage the economy, so why reward them for what they’re suppose to do?
• The Incumbents suffer when the economy is doing badly and don’t get rewarded.
• Al Gore should have won in 2000 but this didn’t happen. The economy was doing well.
• Reagan’s victory in 84’ isn’t true.
• The final assumption, the notion that people vote their pocketbooks. Consult your booket book, more money in your wallet four years ago.
• People often have sociotropic evaluations; they vote on the basis of egocentric voting. Some people vote on sociotropic voting.
• Do you find it puzzling that people vote more sociotropically then egocentric. They care about the economy as whole more people who are maximizing their utilitiy. It’s people who are more likely to think about their collective good.
• People assume that they govern their own wellbeing while the government are more responsible for the rest of the population.
• Researchers have found it puzzling: they asking what have you done for the economy. We should love our neighbours but we shouldn’t love our neighbours more than ourselves. Some people find it odd that they are only responsible for macro-conditions.
Problem 4) assume that people vote their pocketbooks.
Its most often socio-tropic voting (the economy as a whole) that we observe. Evaluations trump egocentric (pocketbook) evaluations. Many people care about the economy as a whole, more socio-tropic value democratic participation.
• Other problem with socio-tropic voting: it puts a heavy burden on voters. You know things aren’t going so well. To figure out how the national economy is going. The media won’t give you the information about yourself. Where as you know how the countries going overall.
• It might be impossible calculus: there are elements that people. The prices change overtime so they realize that things are changing.
• TV is cheap. There as a time when computers are low prices. I have a computer now and didn’t have one three years ago.
• We may underestimate the value of pocketbook voting: socio-tropic evaluations are shaped by egocentric voting. Am I doing better, and then they extrapolate for how the economy is actually doing.
• If you have a regression analysis and social tropic evaluation if egocentric evaluation and socio-tropic evaluation. You will underestimate the value of egocentric evaluations so we may be underestimating the effect of egocentric evaluation.
• How do you evaluate the future look at the past.
• Another thing to realize about economic voting is it tends to be contingent. Looking at a country across time, Clarke and Convert: economic evaluations don’t necessarily have political relevance: the only time it has impact is if it effects the government in power.
Harold Clark & Stewart:
sociotropic evaluations shaped by egocentric valuations. Pocket book voting has been underestimated. Also egocentric voting is underestimated: if egocentric affects sociotropic and sociotropic affects vote choice, we will underestimate affect of egocentric voting.
• Idea is that peoples own circumstance will give them an idea on how the economy overall is doing.
• For Clakr and Stewart: economic voting are contingent of the context. Economic evaluations only have political relevance if they attribute responsibility to the incumbents.
There are two critical conditions for economic voting to occur:
• 1) Clarity: what happens in the federal system, who do you blame the federal government the provincial government. There clearer the conditions of economic voting the less clear the economic voting you will see. Economic voting will be more significant in coalition governments.
• Is it the presidents fault: is it the senate, is it the house? People are able to assign responsibility and blame.
• 2) Alternatives for decent: the alternative parties need to be a clear party alternative. You need an alternate class.
• What might cloud responsibility? Disasters that influence the economic downturn.
• If the party has been in power for only a few months the government was in power for too short of a time. Blais/Nadeau short-term election.
• 2004 Martin tried to distance itself from the government but he didn’t talk about the economic performance.
• The US economy and the Canadian economy. The Canada is subservient to the American economy. Our exports go to the US. The Canadian economy looses the economic controls and levers. NAFTA, the global economy and the less the government is more powerful.
• The Ideal political setting for economic voting is Unitary State or a highly centralized federal system with two parties. Canada has neither requirements. We also are heavily reliant on the US economy. All of these factors serve to weaken economic voting.
• When you have 5 parties in power in Quebec.
• The economic voting isn’t very strong in Canada. And yet Nadeau/Blais which suggests you can predict based on economic variable. So why can you have such discrepant results and random economic vote shares.
• What does the Nadeau/Blais: imply for economic campaigns. Can you compare economic voting.
Economic Voting:
• Economic voting is not strong in Canada when it comes to survey data. Do they think they are going to be better off then they were four years ago. You need to relate them to a study.
• Canada is reliant on the US economy.
Blais-Nadeau
• Blais/Nadeau suggests that economic conditions predict vote choice very well. They use a different method> there is a lot of debate. They used Election Outcome from 1953-1988.
• We ought to look at objective economic conditions: individual economic judgments the other approach to macro-economic conditions and relate that to the other part.
• The aggregate level approach is to focus on popularity look at popularity functions and people have taken Gall-up polls to rate the governing party to changing evaluations.
• Blais/Nadeau 1953-1988. They looked at real disposable income as probably the best reflection of individual wellbeing. They looked at inflation and unemployment.
• Only of the economic variables is statistically significant: Unemployment.
• 1 pt in unemployment rate compared to 5 years ago translated into 2 point drop in vote share.
• Unemployment and inflation effects voters the most. Unemployment and inflation get played up by the media. The measures are all relative, it’s not the absolute level of unemployment that matters what hurts is when there is a change. Government don’t have to pay as tough a price.
• It turns out that one of the economic variables: is statistically significant is unemployment. This model assumes that the national level. They found that an increase in 1 point in unemployment reduced the two point drop in vote share.
• One none economic variables: the provincial origin of the party leader: paying from Quebec has a 5% value. Boast it’s share of seats in Quebec.
• A vote shares rather than seat shares.
• They are able to correctly predict vote shares.
• Voters punish unnecessary elections. 2000 was election was designed to call an election.
• Campaigns could be charitable. Campaigns don’t matter.
• That model works very well from 1953-1988 it doesn’t work subsequently.
• NAFTA allowed them to pass the buck on employment. Globalization.
• The economy didn’t matter when the new era of 1993-2006 opens the politics system being so fragment.
• The model is covariant the causal link may not be helpful. You may find the causal element with people that are making the voting decision.
• Hard to imagine to find an underlying factor in flux in party voting shares and economic performance. There is something going on.
• Polls only move
• There is a monitorial model: citizens don’t need to pay attention when there is a run-up to an election.
• Another problem with these models: you specify these models: what period do you look at when your analyzing the voting. You can fit a model to the data points.
• You try to have a three year and then change the model to 2 year and the .5 years.
• Fitting a model to a few data points.
• There is one huge reason that they fall apart and that is they assume that it’s objective economic conditions. Perceptions matter. Perceptions mediate the economic decisions.
• Blais model should have shown that in 1997 the Liberals should have been rewarded but their vote share didn’t go up. But it wasn’t a winning issue. Voters have negative perceptions.
• 80%of people didn’t believe that the employment rate had gone down. Unemployment went down two points. Those negative perceptions limit the scope of their victory. Fitting a model through a certain points.
• Over 80% believe that employment had not gone down and 40% thought it had gone up. Chretien had promised more than they could deliver in 1993. They didn’t play up their performance for that reason.
• Perceptions hurt the liberals the probability was 8 point higher then they would be more likely to vote liberal. The impact of the liberal point share.
• They thought things would have been going up in the future.
• They were in a bind: after 1993.
• It had similar problems in the UK and got the outcome right. US predicted in 2000.
Election 1997 experience drives home three points:
• 1) economic perceptions matter and they don’t always agree. What is the unemployment level? Minimum wage can’t get the wage right. People just don’t care.
• 2) The economic is a valance issue: a valence issue is where everyone agrees on the goal: a healthy economy. There isn’t a policy position. A healthy economy: we’d be better economic managers. We are more competent to manage the economy. Parties don’t take opposing stands on the economy.
• It wasn’t us it was global forces, unions, NAFTA blah blah. What couldn’t about how much the economy is doing. Its how the parties frame economic performance. Who’s partisan claims are they going to claim. What the parties have to say and it depends on what they media intends.
• 3) Perceptions: the unemployment rate may be higher in one region than another. Their occupation and social class. People in a vulnerable positions and some people are going to be more injured. They think that they are an serious danger of losing their jobs.
• 4) The medias perception of the conservatives: sometime you think there is a completely different campaign going on.
• They are more likely to get dramatic images people lined up in the streets.
• 5) Partisanship: could effect perceptions: we have trouble reacting to events: an economic record is good enough for an incumbent. People who are in one party will think that they are doing a horrible job. We tend to see what fits into our party disposition. We see things more negatively.
• Those assessments mediate economic impacts.
• Blais/Nadeau assume that it is relative economic conditions. BUT in absolute conditions in 1997, the absolute level was still sufficiently high for the liberals.
• Retrospective time frames: Nadeau/Blais people are very myopic in terms of voting some of the voting took place. Voters look at a short time frame when they look backwards.
• We assume that economic perceptions have a direct effect. Clarke and Kornberg: the two issues: Canada US free-trade agreement. Voters were so negative about the GST they become increasingly negative about the negative on NAFTA. There could be indirect economic voting
Lessons from “It’s Unemployment, Stupid”
**What counts is not necessarily the state of the economy, but the way voters perceive the economy.
**Absolute conditions can matter (1997 unemployment dropped from 12-10, but 10 is still a huge number)
**Voters are fairly myopic when they look backwards, see only a short time frame.
**Clark and cornberg say can views on economy can affect vote indirectly by affecting views on the issues. Voters were so negative about the GST and became increasingly negative about NAFTA bc they perceived that the economy was getting worse.
Party Leaders:
• 1) Are Canadian elections leader-centred?
• 2) Are party leaders becoming more important to vote choice?
• Leaders are more important than anything. Leaders have become more and more important. So there has been a decline in party voting. The more important leaders are the less important.
• There has been little surprising analysis. It’s been assumed across western democracies. The studies: the Rise of Candidate Centred politics.
• Does the American phenomenon travel elsewhere.
1) Leaders are important. Leader matter more in Canada than in Sweden, Germany, Netherlands. Anglo American democracies all have important place for leaders.
• This has been shown Clarke: Superstars of Canadian Politics.
• Mallory: he came up with idea in 1949: Mallory argues for a national theory: the party leader will stay in power as long as the leader is able to embody the nations mood.
• Leaders play a keep role.
2) the first full length book in voting: Diefenbaker Interlude. He chose the name of the book after the PM that dominated the country at the time.
• Governing from the Centre: the presidentialization of Canadian politics.
• In the 1970s there was some speculation about the presidentialization: this idea that we resembled a US president is not a new idea in Canada.
• PM is more powerful in Canada. The PR versus SMD. The electoral system.
• The Liberals and the PC have been characterized as brokerage parties they aren’t necessarily centrist parties but you don’t see a lot of conflict. If you don’t have ideological divisions. Voters fall back on the party leaders. Who looks like who will be the better manager.
• Brokerage politics makes flexible partisan ties. They don’t have strong party loyalties.
• The leader has to find a brokerage group. Mobilize the partisans and the non-partisan ties. The media plays the role: the spokespersons. The way the media covers things make leaders important.
• Leader provides a shortcut for voters: if citizens are rationally wrong. But they don’t want to understand the details of politics. Leadership is the rational short-cut.
• People can look at the leaders personality traits. Are you competent. Are you attractive. Social background characteristics. Female will do a good job of health, and family politics.
• Regional differences. Sex works.
• Religion doesn’t work: not visible.
• Women were more likely to support Kim Campbell.
MEDIA coverage: Matthew Mendelson.
• Matthew Mendelsohn looked at television news coverage there are two dominant frame the Horse race and the Leadership. Who’s gaining group winning ground. The horse race and the leadership race was used interchangeably. The question asked is usually who is going to win and why. It s quiet different to disentangle the leadership horserace. Mendelsohn says the horse race is a shortcut for the voters. Gaffes come to define wow the campaign is going. The media decides what qualifies as a gaffe.
• The leader frame and the horse race frame. The new campaign promise.
• The focus on what the leader has to say the focus is why are they doing this what is their motivation. Mendelsohn if the leader takes a day off then they the party doesn’t get covered.
• In 2000, Stockwell Day on Sunday.
• The other thing that plays a role is the televised leadership debates. The next 1979, 1984 one in French one in English.
• In the 1984 there was a women’s issue debates.
• How the leader does on the debate. A good example: Clarke in 2000 he saved his party from electoral extinction. Otherwise the alliance would have wiped-off the map. The leaders debates: John Turner 1981 Clarke and Charest 2000 and 1997; There was an issue of the timing of the debate.
• 1997: Chretien popularity gave a 5-point boast. Charest had 12 point popularity.
• 2004: probability of voting for party increased from 20-30 points depending on leader (for individual voters).
• Leader are important for vote choice Chretien popularity outside of Quebec Charest didn’t had positive prospects that is why there was hopes to Conservatives. He is not as popular in the province of Quebec.
• The probability increased from 20-30 if they liked the leader.
• On the other hand: leader evaluations didn’t have a big impact on electoral outcomes; in the individual level you have a massive effect. Leader are the deciding factors for leaders: leaders did not have the impact on election. In 2000, 2004 leadership didn’t help the leaders.
• Liking the leader only makes them more likely to support. We’re controlling for the party id. Leon average rating of the leaders: if the average rate of the leaders support can mean that the voters are effected by how they rate the party leaders. Zero to 1000 scale if the leader is remarkably more popular: Bouchard was very popular in Quebec Chretien was unpopular in Quebec
• Look at the presidential realization: have leaders become more important. Why would expect that they would become more influencial in voter choice over time.
LEADERS
• Leaders don’t matter as much about electoral outcomes.
• If one leader is no more popular than individual vote choice.
• The leader is a lot more popular than the others. Leaders have become more important in vote choice in Canada.
• Leaders are more important today in vote choice why are leaders.
• Leader respects the media: Paul Martin. The relationship between the journalists and the media.
• Media focus: gender bias: When Kim Campbell made errors it was an attack. She rubbed the media the wrong way. Kim Campbell: “policy isn’t important in elections.” Chretien said something to the same effect and got away with it.
• People just fall back on leaders. They may not know the candidate. You used to have ca
• It’s a matter of valence issues: who can manage this issue better.
• No party will endorse two-tier healthcare: trust us will do better
Partisan De-alignment:
people are not attached to political parties. At least people are becoming increasingly detached from political parties, can no longer fall back on parties as a guide to vote. Do see a decline in leaners (those who indicate closeness to one party if pressed). People who identify very or fairly strongly if fairly constant.
• If you identify on the line of party loyalty. If fewer people can find a motivation for party voting. It’s debatable whether there is a party de-alignment.
• In Canada, Western Europe: you don’t see a decline who identify very strongly. You see the decline in the so-called leaners. The one thing that has changed is proportion of a residual sense. People who are confident which party is worthy.
• There is a relationship and party de-alignment and
• Patterns of media coverage, they are much more reliant on television. You begin to see the main source of politics is television. Changing patterns of media coverage: newspapers coverage has changed. No more decline since 2000. For leaders, much more fluctuation less decline in leader than in party evaluations (but began higher 1968 was Trudeau mania).
• Media centred politics: the rise of candidate centred politics. Canadian elections resemble Martin, Harper, Layton, Duceppe not the parties.
• Causal arrow changes because of the leader.
• Why leaders vary more? Because individuals vary more than parties do.
• Why party decrease? Inglehart’s post materialism (people care more about self-actualization and personal autonomy, and less interested in parties because they are seen as unnecessary intermediaries).
Trends in average leader rating and average party ratings, 1968 – 2006
• Leaders and Parties
• Turcott: there has been an erosion of party leaders in Canada.
• Both parties and leaders are less popular than they were. People have gone from feeling positively to feeling negatively (for party 10 pts on 0-100 scale).
• No more decline since 2000: Plateau in 2000-2006.
• 1968: Trudeau mania: more popular in that period. 1974 to 2006 is a drop of about four points for leaders.
• Leaders vary a lot more that’s why it fluctuates much more.
• Party doesn’t vary as much. Inglehart “Decline of Deference”: post-materialist ideas: maximizing autonomy people are less interested in political parties because they are intermediary.
• Most leaders suffer a decline in popularity overtime: Trudeau, Stanfield, Chretien. Regardless of how popular they are to begin with. The honeymoon is always over.
• Popular new leader gets a boost.
• Broadbent dropped and become more popular.
• Layton improve his ratings.
• Duceppe was unpopular in 1997: fallen heroes syndrome.
• Broadbent shows that a popular leader doesn’t help that NDP that much.
Clarke et al called this the Fallen Heroes Syndrome (up to 1988). Leader have become more important to individual vote choice, thus party is less of a factor. In fact, Party ratings have more effect on vote choice than leader ratings, probably because party label is all we know about candidates. Leaders and parties matter independently.
• Presidential Thesis (as it relates to elections and impact of leaders): Leaders are more important at the expense of the parties they lead. In fact, party ratings have a stronger vote choice that leader-ratings.
• Each has an effect independent of each-other: leaders impact on parties. Parties effect leader popularity as well.
Evaluate the impact of party leaders by performing what if counter-factual.
• What if leaders didn’t matter? How much would vote choice differ. We calculated the predictive probability. Leader evaluations has an effect.
• If we remove the impact of leaders: leaders clearly do have an impact of vote probabilities. In these simulations, net of how they rate the parties.
• Across the 8 elections, the average is about 8 points: the average probability changes by about 8 points. If leaders got more important, should see a steady increase across time. Can’t in this graph (not much higher now than in 1968).
• Asked them to rate the leaders but not the parties in 1984.
• The effect varies from election to election. The impact of party leaders was barely difference in 1980 and 1988. There hasn’t been an increase in party leaders.
• If leaders don’t matter and they are voting for the party to supporting the party.
• How many people would change their vote if leaders didn’t matter.
• If leaders wasn’t a factor: the impact is a little less than what we expected. Looking at what people were induced to change their vote.
• 6% of people would have voted differently had their opinions of leaders changed.
• Is it liking a leader that attracts them to the leader while negative evaluations may have a larger impact. Being a nice guy won’t drive you to the party as much as hating the leader will drive you away from a party.
• The final aspects: the bottom line: how much difference do leaders make to vote change. Unless one leader is more or less popular: for every person is attracted to a party you can have
• How much would the party vote change if the leaders didn’t matter. For the 8 elections the average impact was only 3 percentage points.
• In 1993, the impact of party vote shares is twice as large. If leaders hadn’t mattered in 1993: the liberal vote share would have dropped to 6 percent, Conservatives gain 4 points, NDP gain 2 points.
• 1993 leaders was really important. The party with the most popular leader would stand to loose the most. This usually means the wining party.
• Leadership mattered most to the losing parties: PC. If leaders didn’t matter Reform would have displaced the PCs and there would have been no merger.
• 1997, 2000 if leaders hadn’t mattered, Reform would’ve done better.
• It will be hard to argue with this data that leader have become more important, if anything the trend is downwards. Seems that as popularity of leaders decline, leaders matter less to outcomes. Therefore, the presidentialization thesis is difficult to argue.
• For leaders to become more important than the parties they lead. As popularity has declined they have mattered less.
• Leaders are important but they haven’t become more important in recent years.
• Leadership is a broader element: if you have a leader that has a charismatic nature it will attract better candidate.
CRITICISM of How Leaders Effect Parties:
• Controlling for party ratings and how they feel about party leaders are very closely aligned.
• Other problem is that the first television election in Canada was in 1957. Maybe if we could find there was a jump of impact of leaders before the period we are looking at. Only after 1968 had people began to name TV as most important sources of info television personalizes coverage more that radio or newspapers.
• Attention to leaders can vary from year to year: we don’t know how coverage has changed and not changed.
• The attention paid to leaders has increased BUT much lower in Canada than it was in the US and France.
• People are voting for a local candidate in Canada and party label. Local candidates have a powerful effect about vote choice.
• Attention to leaders has increased but it’s nothing like in the US;.
• BUT there is a fluctuation: it varies: 1968 a lot of attention paid to the leaders. But sometime parties become more salient. Television coverage becomes more and more salient.
As attention to the media fluctuates
• Some leaders are assests for their party: in other cases the party will play up that party leaders. Some leaders are more visually more interesting more lively personalities.
• Presidentialization thesis.
Who Votes on the Basis of Leaders?
• The less informed, and the people with the least educated parties.
• They don’t have the cognitive skills and reading skills. May not have the resources to find out about the parties.
• Somehow people should be voting about the issues; that we should be weighing the party issues BUT politics is about shaking hands. Giving a mandate to a party: the party has won the election and the party now has a mandate BUT this isn’t true.
• Voting on the basis of leaders: it’s unsophisticated at best about the leaders and at worse somehow irrational.
• If the leader is going to be prime minister, they should be important in the decision making process. Elitist argument: it would be better for people who don’t know the issues don’t vote.
• Sophistications: who looks the best. If you can’t run a campaign if you dress funny. Preston Manning image change in 1997 might be important, here.
• Education doesn’t make much difference for whether they vote on leader evaluations. It’s important for people who really struggle.
• People now say that the Canadian people decided to vote in favour of Free Trade.
• At every education levels people factor in leader evaluations. There is research in Canada and the US. They have a good scheme of what a good president or what a good candidate should be.
• Amount of attention paid to leaders can vary from year to year (no studies comparing coverage across time). One study of newspapers found that more attention is paid to leaders, but amount of attention paid to leaders as opposed to party is lower than in both France and US.
• When you look at the prototype it reflects performance criteria. The sorts of traits are using has an influence.
• When voters in the US are asked: people in the University will make personal comments about the leader. People in University are more about the personality of the leaders.
• Where education makes a difference is in the nature of the comments: the performance related characteristics.
Steven Brown: what do you like what do you dislike about each party leader. The key leadership attributes, dynamism, empathy, personal style, political skills.
• They found that the people who are more educated are concerned with task related elements. The notion of proto-types are relatively enduring.
• Some people have a fairly constant understanding of the leaders.
• Based on theories of social cognition: The studies that look at prime ministerial have a limited ability you can process the information. Human beings have limited capacity to process information we look for cognitive shortcuts. One reason that leaders are important in Canada is that the complexities of multiparty system. People are in more need of shortcuts.
• People can make inferences about leaders based on personal characteristics. Female leader is more compassionate. A leader that has skills in foreign policy will be better at dealing with that area.
Cutler: the leaders social background characteristics. People will support the leader if they are the same as them. If they are male they will not support the female. If the westerner runs the party then they will vote for that party.
• People vote for themselves
• Cutler: it applied across the board that demographic similarity voted for the leaders party.
• The key characteristics are sex, language. Sex matters in 1993. Even though the nDP lost support massively. They did manage to bring women to the party. Conservatives attracted some female voters in Kim Campbell.
The two leader. Men liked Campbell much less than they liked Manning.
• Women were less resistant about negative messages in media culture.
• Cutler: religion didn’t work: Catholic leaders doesn’t make people more likely to vote for the party. Language is obvious: Man or Women
• Media doesn’t talk about the leaders religious supporters: Manning fundamentalist preachers, Stockwell religious. The media made a great play that Stockwell: Fundamental Day, religion is salient: dis-similarity of the religion.
• The Christian Fundamentalist don’t like him very much there.
• 1993: Brendan O’Neil, sex mattered in 1993 because the NDP & Conservative attracted new female voters despite massive electoral losses. Idea that Women more resistant than Men to negative messages about Kim and to positive messages about Manning.
• Exception in Cutler’s study was that religion didn’t work: why? Because language is obvious, gender is obvious, region is well-known, Religion not usually a factor in the media. (Both Manning and Day were fundamentalists, but only affected Day because Manning’s religion wasn’t well known.
• We look at the leaders versus parties: a 32 year span do leaders have more impact than they did in the past.
Do Campaign’s Matter?
• Campaigns don’t matter quite frankly until recently. Until recently, conventional wisdom was that they didn’t matter.
• Why? 1) Columbia Studies: they were 1940 studies. They were trying to understand the impact of campaign communications. They wanted to understand attitude change dynamics.
• Campaign propaganda: they started off with a consumer model. Companies were marketing their products. Campaign propaganda.
• Voters were likened to consumers: debating which car you want to get. SO you might weigh the benefits of one party and the other.
• Unfortunately it was the 1940: Roosevelt election. They didn’t need the campaign to make up their minds. Only about 8% changed over the campaign. Their mind over the campaign.
• Using the language of their consumer model: the major function of the campaign is to reinforce existing predispositions or reactivating.
• Or the campaign would crystallize the attitudes.
• The major function of the campaign was reinforcement. People paid attention to news about their party. That’s one reason campaigns don’t matter very much. There were not real findings that shook this decision.
Blais/Nadeau economic voting. These models show economic voting. If you can take one economic variable and one political variable: whether the leader is from Quebec. It seems you can predict outcomes: these models seem to predict elections. If you can find one economic variable and one leadership variable.
• Campaigns are important for democracy people need to see things happen in democracy.
• If they don’t change the outcome.
• There is a strong tendency to compete: if the parties have equally strong campaigns.
• Economic voting models there is nothing automatic about these process. YOU need the campaign to form their evaluations vote choice.
Time of Vote Decision 2004 and 2006 CES: during a Campaign (38%/29%), On Election Day (14%/15%), Before Campaign (48%/56%).
-before campaign 2004 48% 2006 56%
-during campaign 2004 38% 2006 29%
-election day 2004 14% 2006 15%
Around 15% of ppl decide on election day, and this is consistent across time.
• Study showed that more than half of voters decided on how to vote.
• People decide on election DAY>
• Reactivation the Outcome: 1993 the progressive conservatives failed to reactivate party loyalties. They failed to reactivate the electoral coalition.
• Opportunity for new female candidates to forget yse to media, stuff, learn the ropes.
• Valance ISSUES: issues where everyone agrees on goals but each party has a very different management strategy to show its success.
• Incumbent party will try to shift blame on others.
• Position issues are when voters do take sides. Which policy proposal do they find more persuasive. Do they want $100 month or do they want a national daycare program?
• Help voters locate the parties on the issues: the campaign played an important role. Where does a campaign effect voters position on issues.
When is a campaign most likely to affect voters? On what kind of uses do campaign matter more?
• Same-sex had its people breaking down it’s support. If there is a territorial issue: GUN agriculture. Highly concentrated has a big impact on the issues.
• Two issues that are new and dramatic.
• Bloc says we want TWO TIER health: that would be new and dramatic. Then it becomes a rhetorical issue: Free trade election was almost a one-issue election. It was a rhetorical struggle. The opposition parties called Free Trade the Mulroney deal. “Deal is shady terminology”.
• The opposition parties tried to make it a social issue, lose of sovereignty. The Conservatives were about economic issue: anti-protectionist issue.
Another way that campaigns matter is through priming.
• Nadeau/Mendelssohn talked about priming in their religion reading. Priming occurs when voters change their mind. They weigh some other factor more heavily in their vote choice.
What is primed in a campaign?
• Leaders: media focus. Difficult to downplay leader in debates. As election day gets closer, leaders should get more important to vote choice, especially of those who pay attention to news.
• The extent to which leadership gets primed depends on the campaign.
• Are they going to give the most weight on party loyalty
• Leadership as a primary factor. The Party ID.
• As election day draws near you would se leadership play a more and more of a role. Precisely because of the personalized way people cover elections.
• The leadership depends on whether it gets primed.
Issues: parties has a strong incentive to prime issues. They want to give voters & parties loyalist a reason to vote for them. The extent to which issues get primed depends on the issue. It’s been a period of high unemployment.
1988 issues primed: free trade: exception.
1993, 1997: either classic valance issues or multi-issue agendas. Issues crowd each other out.
• Some issues are already salient with healthcare. There is much less scope for day to day issues. Of the three elections, the only one.
• In 1993, 1997 you either had classiv valence issues: and you had multi-issue agenda’s Your much less likely
Party ID:
• Priming people’s party loyalties. Some people are Liberal to the core, but even party loyalists will tire of voting for a party if it doesn’t remind them of why they are partisans 2000, 2004: Liberals ran a values-based campaign.
• The Liberal Values mobilized the partisan.
• Parties have a strong incentive to prime party ID> The typical election campaign generally de-primes party ID. If you think about the Michigan Model makes sense here> People vote for the party id unless short-term forces are sufficiently strong to change your vote. The more an issue/leader gets primed the less important party ID becomes to vote choice.
• It can effect their vote by getting them to see the leaders.
• Priming is a zero sum game: priming is media effect because they personalize coverage.
• Campaigns affect directly (make them change/make up their minds) or indirectly (affect basis on which they vote). Priming explains why People change their minds (election is REALLY about leadership, rather than other issues).
Campaigns don’t effect all people equally. Matters most for those who aren’t strong partisans. Some voters have seen their mind by direct attack and priming is indirect. What’s this election about? It may be leadership.
• This will work with people who aren’t strong partisans. Those people will be hard to persuade. There are others who don’t have a predisposition to support a party.
• Campaign matter most to people who will make up their mind during the campaign (seems obvious, but if we want to measure campaign effects we must look at the half of people who haven’t already made up their minds).
• If you look at everyone you’re going to see that half the people have made their mind up already.
• Campaigns aren’t going to affect all people equally. They affect non-partisan mostly. Young people are more likely to make up their mind in the campaign.
• Even people who decide on election day: campaign deciders are a little less interested in politics. A little less knowledgeable about what the parties are promising. Some of the people who decided before hand they decided they were interested.
Reported Vote by Time of Decision 2006:
Before Campaign
• Liberal 30%/26%
• Conservative 41%/41%
• NDP 15%/20%
• Bloc 13%/7%
• Greens 2%/7%
• First Two weeks of the Campaign
• Lasts Two Weeks of the Campaign
• Liberal (35%/26%)
• Bloc (11%/6%)
• Conservative (21%/31%)
• NDP 15%/22%
• Greens (4%/6%
Campaign Deciders: Vote Choice and Vote Intention 2006 CES
• Liberal intention
Evaluation of Debate Performance, 2000
• 44% Clark, 10% Chretien, Day 17%, 5% Duceppe.
• Interviewing data.
• Joe Clark’s winning debate performance in 2000 helped his party with a 4 point increase after the debate.
• Chretien ratings dropped 3 points and remained there. Chretien weak performance in the debate cost 2 percentage points and remained there.
• Important for Conservatives & NDP because they were facing electoral extinction.
• Relationship between standing in the polls and coverage. The party needs to do better than expect if a minor party wants to get coverage.
• Do telephone polls affect the way people vote? People do use poll results to decide how to vote, but surveys themselves shouldn’t impact vote decision. Problem is that people surveyed are more likely to vote because if the agree they are likely to be interests and by talking about the issues people deliberate and decide to vote.
• The campaign was not that consequential.
MEDIA EFFECTS
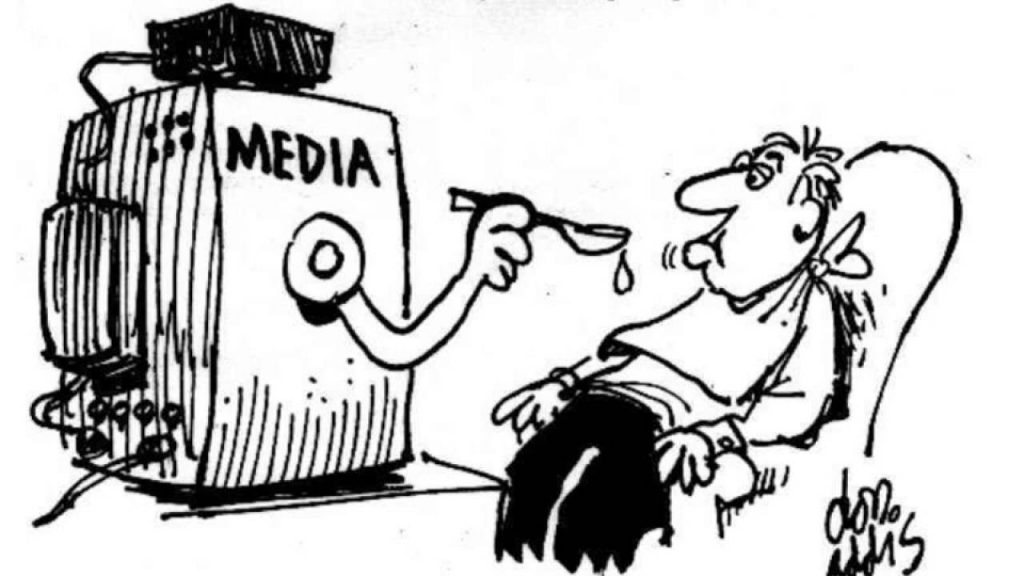
• Conventional wisdom until recently was that media a little effect. Initial academic thinking believed in massive effects of media (Lipman Lasweel: idea of a hypodermic injection of propaganda). To say there is a minimal effect of the media runs against our intuition.
• The massive effects thesis was destroyed by the Columbia School in Eerie.
• Columbia school found that media reinforced existing/reactivated and preferences and crystallization. Minimal effects attributed to selected exposure and interpreted news as favourable to their party even if it wasn’t. So the predisposition was stronger and reinforced existing preferences.
• There was some cases where we saw crystallization: people could preict the values and the media and the campaign crystallized their position.
• Selective exposure: people who were Republicans pay attention to Republic media. When they watch the news they saw favour in their party.
• Preaching to the converted
• There was a two step flow of communication. Opinion leaders every stratum of society. The people who are most partisan. These political junkies and then they talk to other people: water coolers.
• The Two Step Flow of Communication: does it still apply.
• The 1940 Columbia School left academic community with idea that media has minimal effects. Renewed attention in 1960s (TVs more widely available). Expectation of more media effects, disappointing results.
• Television is a different source of medium most accessible. Doesn’t require cognitive resources so there was an expectation that we begin to see more effects: IT DIDN’T HAPPEN.
The Limited Effects: Not-So-Minimal Effects Thesis:
These researchers saw the power of the media on what to think and how to think about it.
• Agenda setting relates to priming: the media had taken a lot of emphasis on leadership. IF the media play up a particular issue: on the leader.
• Another indirect effect is framing: how the media frame a story can effect people’s views. Some parties seen as owning particular issues. Was Free Trade about social issue or an economic issue?: getting access to American markets…
• Agenda Setting and Priming are related. Priming occurs because of Agenda setting. There are more direct effects.
• Agenda setting occurs when media attention increases the important of that issue. It sets the election agenda. What’s the election all about?
• The amount of attention in the media was an issue primority.
• This agenda setting was a case of the media telling them what to think about. Which issues they should think about. Determining the salience of issues. The more coverage an issue receives the most important the issue.
• Why Agenda setting is important? The media might focus on issue ownership. Some parties own a particular issue. Parties that are Centre/Left on health, education. Parties of Right own economic, inflation, crime national security, foreign policy.
• Parties have enduring image of being good.
• Parties will try to play up the issues that will help them. They will play down the issues that will hurt them.
• Think of campaigns of competitions of control of the agenda. Parties try to set the agenda. They want the parties to focus on the issues that they are strong.
• Media is a critical player. It’s still the case that the parties are heavily reliant on the media to get their messages out.
• The Internet, Email Campaigns has provided with more direct communication with voters.
• Parties rely on television. The parties are reliant opn the media to get their messages out. That’s why agenda setting theories are really media theories.
• It’s not a competition between the parties and the media. The media aren’t neutral: They are FILTERS: The media mediate the flow of communication.
• The media pick and choose.
• The media has to worry about audience share and readership: they depend on advertising revenue. Advertisers will want to buy advertising time and space.
• The media will play up some stories and play down others. The criteria they use: it is a right wing and left wing bias.
• Media content is governed by news worthiness. You have to provide content that will attract viewers or readers. That means selecting stories that feature conflict.
• There can be a selection process at work. The media may decide to highly. Can hurt some parties. The media will not necessarily line uip with the agenda of the political parties.
• The final thing: agenda setting is a zero sum game. One issue gets played up the more airtime. T
• The New York Times: on ABC, CBS will fit on the NEW YORKTIMES> Mansbridge said that the CTV, and the Globe and Mail. If you transcribe the news on television. There is only so many stories of the news paper
• Why might you expect that agenda not very strong. A lot agenda setting tends to not be very strong.
• Those commercials that play up particular issues. In that sort of situation you see strong agenda setting.
• Media emphasize the gay-marriage issue.
• There are different media sources: There is a pro-liferation of media sources. Now there are multiple places for exposure to news.
• Stuart Soroka: did a dissertation and looked at the coverage of newspapers; the agenda was similar: if you looked at any period of time you might see a difference amounts of attention overtime the fluctuation was very similar no matter what the region of the country. But when health become more important it was more important everywhere. Some stories are sensational and therefore have much potential (gay-marriage, scandals). This didn’t hold, in 2000 health-care was already prominent but because more so.
• The news stories news cycle: you can go
• Maybe people have become more political consumers of the media;. The Biases in the media tend to be very subtle and when you do that it is amazing.
• People have to be paying attention. Some people don’t pay any attention to news. Stuart Soroka typology had a priori; Stuart said there were issues that were important there wasn’t much scope for agenda setting.
• Most evidence for agenda setting occurred with health. Spending on social programs become more important. Crime want’s very important there was limited agenda setting effects.
• Another factor there isn’t much issue coverage: ¼ of stories focus on issues. Polls, horserace, gaffes, leaders. The media is focus on the horse race. Framed by the leaders/horserace. “Why is the leader taking that position now? Who is he trying to appeal to??” Who is behind who is ahead. It’s the leaders. When the issues are covered why is the leader common to appeal to who is this supposed to appeal to.
• When you look at the way the media portray the issue they want to attract the votes. People who are paying attention there is proliferation of media sources. Different issues lend themselves to agenda setting effects.
• ¼ is type of all democracies in Canada.
• When we looked at press releases.
Media Coverage: Objective of the Parties:

1) Agenda setting we want the media to focus on the issue that they ‘own’.
2) They want to be visible. The voters are least likely to see the NDP would be their natural constituency.
3) They want to have positive coverage. Their coverage needs to be mostly positive.
• Parties that can’t form the government don’t get much coverage: NDP and PC got much less coverage. English Canada did emphasize the Bloc
• In Quebec these is a big visibility bonus. Martin promises a nationally funded day care program.
• A lot of people will only see the headlines: Just get the headlines: There is usually a story about each party. There are five stories and then a general story about how the parties are doing.
• The two leading Parties get a large share of the headlines.
• The most dramatic evidence: When we look at the order of presentation. NDP is last almost always. CHECK WebCT.
• It gives people a clear message. These are the also runs in the fourth event in the news.
• The order of presentation about the election.
• You see a pattern of negative news stories. The frontrunner get more coverage more prominent coverage but they get much more negative coverage.
• Does the tone coverage matter>
The Mendelsohn/Nadeau Reading: example of not-so limited effects. Gidengil says it’s a possible EXAM QUESTION: Include the article for Religion on mainstreaming Catholics who pay attention to the media. FOR THE EXAM. Why? Can do content analysis of media coverage day by day & link with changing voter choices (polls).
• The Mendelsohn/Nadeau reading “The Rise and Fall of Emerging Candidates” is a direct persuasive effect. One reason we see direct persuasive effect. When the change is made to interviewing people in the campaign. They did a content analysis of the media coverage: you can see how voters are voting. How they evaluate the leaders you can link up changes in the nature of media coverage and changes in issue salience.
• They document a phenomenon that was first observed in the US. It looked at Ross Perot. The Rise and Fall of Candidates.
• They looked to see it a pattern was held in Canada. 1st: The media really take to this person: then that person becomes a serious contender: Ross Perot: the Kim Campbell suddenly realize that they haven’t been critical and then go to the ultimate extreme.
• A lot of Kim Campbell but by the time the Conservatives were level at zero: Mulroney’s popular 10% unpopular (as popular as his shoe-size).
• The election campaign media become much more critical than Kim Campbell. The media focused less on the personality of Kim Campbell, but more on the partisan figure. “Elections aren’t for policy discussion”: It was seen as a gaff. It wasn’t seen as out of touch with the people.
The media: focused on Kim Campbell the partisan figure all the negative baggage. “Kim Kim your just like Him”.
• They were reminded about the Conservatives; GST and Constitutional Wrangling Charllotteton and FTA.
• As the coverage becomes more negative: evaluation of Kim becomes more negative. Nadeau and Mendelsohn are able to note the changing tones for Kim Campbell than the changes in Conservative voting intension. The Conservative voting intentions and the relationship of Kim Campbell and the changing tone of coverage.
• There are negative shocks: Voters are ensured to negative coverage;
• People are used to it and they come up with a negative shock methods.
The Ideas of Shocks: media has to be really negative to be really effective.
• They define as shocks when Kim Campbell attacks were more negative shock. Coverage has to be really negative than average very low thresholds. 1/3 of the days qualify as shocks. You need to have a lower thresh-hold higher threshold according to Gidengil.
QUESTIONABLE:
• If a leader was shown to stumbled. Negative story. The medias was doing that in every party. Not everyday counts as negative and positive coverage.
• The other aspect is that they use the same days news coverage. They use the late night news but people are covered in the afternoon: hard to believe that people are being influenced by the news they haven’t yet seen. The content analysis covers the late evening news and evening news analysis BUT people interviewed won’t have seen it yet.
• The shock idea was a good one but there is cumulative coverage: positive tonight, negative again, negative neutral it won’t have much impact on people. Negative could have an impact on people but the steady dripp drip drip of several consequative negative stories may lose the effect. Having consecutive either positive/negative coverage would make a difference.
How do we conceptualize the impact of the media?
• The polls aren’t that important.
• The public private funding CTV gets a bit mushy. There is some limitation tot eh Mendoslon Nadea article. Stockwell Day was an example as the Rise and Fall coverage. Day is the new Trudeau. People love building someone and knocking them down. There is a conscious stepping back that occur
• NDP Leader Alexa McDonough: We tried to evaluate the leaders and valythe various leaders.
• The previous nights coverage. Both tracked evaluation on a zero to 100 scale. The mean of the media coverage We were trying to see when media become more positive. When coverage is negative evaluation are positve. And the then when the it’s positive coverage come more positive.
• There is a statisticatlly negative relationship. The more positive the coverage the more negative the ratings become.
• The tone of media coverage made the scale of coverage: evaluations were positive on average. His media coverage is almost always negative Maybe it was the coverage was Charest. Check WebCt graphs.
• Preston Manning Reform: he obliged: as statistically positive relationship and the tone of coverage. Here there is a strong relationship Canadian media coverage effecting medias evaluations. Something else could be driving this other than media coverage.
• The media simply reflected the people.
• Vote intentions moved before media coverage. Jean Charest: coverage of Charest become increasingly positive. After May 24, there was much more negative coverage, but evaluations continued to climb (rise and fall?) mixed evidence. There is a one or two day lag (between media and audience response). Positive coverage is driving up Charest. So much coverage: “But wait we give this guy an easy ride!”. The PC had lost their party status. The media was becoming much more negative in their coverage.
• Its mixed evidence. Jenkins article.
• Horror Stories: 1997 do we want another leader from Quebec. Bad ads desperation. Always get this: it didn’t make a difference.
MEDIA
• Limited Effects: Not-so-minimal Effects Models
• One last way that media can make a difference: helping voters learn. This is a way that campaign can matter in general. This helps voters locate parties.
• Campaigns are a time to catch-up for the average person: helps the voters learn where they stands.
Richard Jenkins: studies Reform in 1993 election. The campaign mattered because it allowed voters to locate Reform as a party that wanted to cutback to the Kensyian welfare state. Effect began to show in the 2nd week in the campaign.
• Change in Reform voting intentions as knowledge goes up (both up). Jenkins relates this to the amount of media coverage Reform receives, which spikes just before voting intentions do.
• A women thought that Reform was going to stand for a stronger social safety net. “Oh, yes…I support reform!”
• If you track people’s knowledge of reform you see people start to get it right. The effects showed up in the second week of the campaign.
• What the Reform is all about. You also see a change in voter intentions. Knowledge about Reform goes up. The key point in Jenkins is that he relates this to the media coverage and the coverage goes up before we see real changes. We seem more coverage and they understand. Vote intentions increase accordingly.
• Why study of media effects: why if we look at the electorate are we unlikely to see strong as a whole.
• No one spends the time to learn. No one has an incentive for politics. People just don’t pay attention.
• People contest to one party: people aren’t Blank Slates. Even when we see messages that strike us.
• Peoples social identities: People who were less disposed to accept the message: Fred Cutler: gender identity severed to innolate they may have very coherent ideas about politics.
• The two mediator model: the two mediators: 1) reception and 2) acceptance
• Harder to comprehend messages if you don’t have an existing knowledge. If we hear the NDP has a prescription drug plan. Reception is critical. Even if people received the messages they may not accept them.
• Resistance: people will resist analysis will resist by media messages. This is the model that Jenkins is trying to test. He needs to find someone’s likelihood of reform.
• People who think that deficit reduction. These are the sort of people who are most likely to support deficit cutting message.
• Some people who like the Reform message. People who are supposed to reject and you get predisposed not aware, neither pre-disposed or aware.
• It’s the people who are predisposed wand messages who are the most effected. The 25% increase for the people who are going to vote reform.
• People who pay enough attention and are predisposed are much more likely to change their vote.
• Among people who are aware it is only the people who are predisposed.
• Finally who are unaware; were not much effected.
• There is a second telling: that Jenkins. Reform is threat to national unity. People who support reform are ethnocentric. Immigration didn’t have an effect.
• When these Negative Views: who are the people most effected: the people who paid-attention. But did not like the fact that this would exacerbate the constitutional crisis. You see a trend away among the people who are aware.
• Interesting ly with low awareness they have began to catch-up on a lag. They aren’t paying attention. That’s the two mediator model.
• You have to pay enough attention to the news but you don’t have
• A co-linear relationship: people who are in the middle of attention and awareness but they aren’t so tuned into politics THEY WILL BE EFFECTED the most.
• Jenkins doesn’t mention that the intensity of media coverage,.
• There are other issues that don’t get attention at all.
• It’s not quite as simple as Jenkins model implies. People don’t pay attention people don’t have predispositions.
• Are these groups predispositioned equally or is there some other measure.
• He dichotomizies the various group. The Median for the sample establishing the dichotomy.

Knowledge Voting
• Knowledge how much people know about politics. A lot of people know a little and a few people know a lot. That conclusion is reached in the US.
• Information shortcuts for voting behaviour: The most basic think people could know: the names of key political plays. Who is the leader of the Liberal, NDP, Cons, Bloc.
• In 2006 people did much better than in 04.
Knowledge of Party leaders/Premiers 2004 and 2006
Lib 2006 84; 2004 83
Cons: 84, 60
Bloc 85; 79
NDP 75; 55
Provincial Premier 72;70
• You get 87/86 were able to name the leaders. 14% of people interviews didn’t know Stephan Harper’s name.
Knowledge of Political Figure: Federal Finance Minister: 2000
Federal Finance Minister (1997)
• 2004 General knowledge: Provincial premier 70%
• Primary responsibility for healthcare: 52%
2006 General Knowledge
Cut GST (Cons): 95%
Provincial Premier: 70%
Judge in sponsorship scandal: 70% (despite the election turning on the sponsorship scandal, and half the ppl getting multiple choice questions)
Gomery report cleared martin: 55%
British PM: 55%
Female Cabinet Minister: 32%
• Female cabinet minister who ran against Martin: 43%
• Prime Minister at time of CUFTA (Canada US Free Trade 55%).
• Cut GST (Conservative) 93%
• Provincial Premier 73%
• Judge in the sponsorship case 70%
• What didn’t the Gomery Report. Gomery Report cleared Martin 53%
• Female cabinet minister 33%
• Politics isn’t very salient in peoples lives. Does it matter? Feminist scholars are particularly critical of these questions because women score lower. If ask about things women need to know, then women will score better.
• People who are likely to vote, know more. People who know more are more likely to vote.
• We are likely to be understanding how little they know. The none-response issue: there is always drop off: it’s people who aren’t very interested.
• We over represent people who vote. People overestimate the number of voters. If people are not interested enough to stay on the phone 25. It’s a Canada wide sample. Interviewed for 25 minutes.
• We over represented young people:
• Do we have good spread? YES because it pairs with election statistics.
• Are the people who are voting do they know? Is this okay? What is the down side of the people vote. Is there is an educational process in voting?
• The distribution of knowledge is uneven. Certain groups of people have the most knowledge then you’ll have people who are less knowledgable.
• The enlightened choice will not occur with uneducated people their interests with the correct choice of party they have cast the wrong vote.
• Do people know what parties are saying. Can they link up party.
• People know GST very clearly.
The 1993 Federal Election: Support GST (Conservative) 63%
• Oppose GST (Liberal, NDP 52%
• Do away with NAFTA (Liberal and NDP) 53%
• Increase public works spending (Liberal) 47%
• Eliminate deficit in five years 45%
• Eliminate deficit in three years (reform) 42%
• Lucienne Bouchard grilled Kim Campbell about the deficit.
2000 Federal Election
• Bring in single tax rate under 100,000 (Alliance) 39%
• Bring in criminal biker law (Alliance and Bloc) 38%
• Bring in national prescription drug plan (NDP) 23%
• Bring in law to repay debt in 25 years (Conservative) 16%
2004 Election Knowledge of Party Position
• Drop gun registry (Conservative) 58%
• Increase military spending Conservatives) 56%
• Do away with the Federal Sales Tax on family essentialist (NDP 49%
• Spend 4 Billion dollars to reduce surgery wait-time 49%
• Spend 250 million AIDS in poor countries 41%
• Inheritance tax on estates over 1 million dollar (NDP (34%
Socio-Economic Status and General Political Knowledge (2006)
• Less than High School 2.1
• Completed High School 2.4
• Some post-secondary education.
• The single most important characteristics is the formal education; the more education people have the more they care about politics.
• There is a gender gap: it can’t be explained by education and income. There is a gender gap political knowledge. You can control for education.
• The ability to internalize the education.
• Disciplines; university education: those with an education in all fields not just Political science people. Everyone in University has an increased understanding of the politicians.
• There is a relationship between education and social networks. Social networks provide an opportunity will pick-up and education. So they will run into people with certain social politics. The people who talk about politics: you don’t want someone to have acquire a new education.
• Government becomes more salient over time. University government interaction.
• Basic literacy skills have an include. 25% of the pollution can’t read at a Grade 5 level. Education instills information and process.
• Another thing to do: it instills norms of civic duty. There is something about university education.
• The final Think: education is related to income. If you don’t have a lot of education you may not have a very high income you may lack the resources to participate. Taking a newspaper, having the daily newspaper fro some people the sheer cost of a newspaper may be too much.
• Also if your trying to make ends meet; you may not have the time and energy to pay attention politics: you don’t have time to learn.
• The other income effect: income gradient isn’t as steep.
• The other thing to do on income is how you preceive the system: then if the rich getting richer and the poorer getting poorer.
• So people who are affluent they have resources and cognitive skills.
• Income both have an effect.
• Formal schooling can help compensate for material disadvantage.
• It’s not just the people who are poorer.
• The Gender gap wasn’t big in 2006. It was a statistically significant gap. In western Europe. We keep see this difference.
• CEGEP women are no better informed than men who dropped highschool.
• Women with house hold incomes are not better than women in the
• Women with education and income don’t matter to women.
• Are you surprised for education gap.
• Women are more likely to graduate from university undergrad.
• Women are socialize to not like math but there is a claim.
• People are primed: political science communities. Psychological agency.
• It’s going to take more women elected in Canada. Women don’t’ care about female politician.
• Only 51% knew MacDonough. 14% knowledge gap about Sheila Copps gender.
• Stephan Harper is anti-feminist says Gidengil.
Knowledge Voting Analysis
-Cognitive misers, therefore people are rational in being poorly informed about politics.
-Aggregationist argument (Paige and Shapiro in the US). Core idea is the collective public opinion can accurately reflect the needs and wants of the citizenry even though many individual expressions of opinion are ill informed and inconsistent. Magic of aggregation.
-Low information rationality argument: gut reasoning. (poking in the US, Sniderman). People can make use of info shortcuts that enable them to reach the same choice that they would have made if they were fully informed. Therefore it is quite rational to be ignorant.
Aggregationist: when people don’t know the answer, they will tend to oblige interviewers with answers despite having non-attitudes. Answer more or less randomly, will express inconsistent opinions.
Shapiro finds a basis for optimism in this fact: randomness is a positive thing, because in the aggregate the random errors will cancel each other out. Draws on the condorcet jury theorem which shows that under certain conditions the quality of group conditions can be superior to the quality of the decisions of the individuals that comprise the group. Applied to questions of political choice, the theorem implies that every citizen has a better than 50/50 chance of getting right, thus probability that majority opinion will be right is virtually 100%. Right in this sense means “the decision they would have arrived at if they had been fully informed – enlightened choice.”
As long as probability of individual citizens getting it right is over 50%, the theory works.
-show that collective public opinion moves in predictable ways, thus is not random but meaningful. When intensions mount, support for military spending increases and reverse. Crime rate goes up, support for get –tough approach goes up. Etc.
-ensure that always better than 50/50 is by using info shortcuts. Truly random opinions will cancel themselves out, some people will be well-informed, and others will use info shortcuts.
what are some flaws in the aggregationist argument?
-easy to manipulate people by providing seemingly trustworthy shortcuts
-evidence is consistent with systematic biases in public opinion. Opinions of uninformed aren’t random, but products of systematic bias. Are conventional seeming answers actually the rational approach (like getting tough on terrorists when cars cause many more deaths)?
-even if people were well informed, they wouldn’t necessarily arrive at “progressive” conclusions. However, statistically, the impact of info is to move people to the left.
-problem: citizens aren’t just uninformed, they’re misinformed. People will overestimate the amount of crime, how much of the budget is used on welfare, etc. consequences are more serious than uninformed (random self canceling errors) because get systematic basies in collective public opinion.
-the only of the 4 items on which people seemed to be correctly informed was gap between rich and poor was growing. (crime, pollution, aboriginal, gap between rich and poor)
Misinformation and policy preferences
-misinformation doesn’t produce random policy preferences, errors don’t cancel. Many people would probably take diff positions on policy if they had the facts straight. Misinformed are more likely to want to cut welfare, cut aboriginal spending, do less to re-abilitate offenders etc.
-low income people are also misinformed about the gap between rich and poor
PROBLEM 1: can’t necessarily count on aggregate analysis to overcome shortfalls in information
Problem 2: assumes the information is evenly distributed across the population, don’t take into account uneven social distribution. Best informed are white, affluent, older males. This is important because collective expressions of public opinions are more likely to express the needs of this more informed group, and thus so will govt policy (to the extent that it relies on public opinion). Because people who are poorly informed have less than a 50/50 chance of getting it right.
-distribution of public opinion would look diff if people more informed. Study asking what if people who are uninformed were all well-informed as people who share the same social background characteristics. What if women in general were all well informed at the best of women sharing their characteristics?
Actual vs Informed Public Opinion
-some questions with only small differences between simulated & actual opinion. Better informed swing to the left. On some questions, it seems to work, but on others it is very different. 10 questions changed by more then 5pts. Av diff between actual & informed opinion was 10 pts.
-standard for informed opinion was rather low. (name 4 party leaders; correctly associate 4 policy positions with 4 parties)
(Social policy): average difference was 7.5 pts between actual and simulated. Informed opinion was not simply different, it was systematically different. More opposed to death penalty, less likely to be anti immigrant. Why does opinion move to be systematically more liberal? Don’t know. Most important result is for the death penalty because people change sides (actual opinion favours, informed opposes) shift from one side to the other is consequential. Last time parliament debate death penalty, the MPs collectively became less favourable to it as they debated. Maybe this is because education tends to make people more tolerant. (liberal moving opinion has also been observed in the US, UK, Australia).
-maybe more informed have a liberal bias because media has a liberal bias.
(Fiscal issues)
-doesn’t apply strongly to fiscal issues. Av diff is 4%
-vote choice doesn’t seem be be affected, though policy preference is. Maybe for vote choice there are so many possible reasons to vote that polic isn’t at the top (maybe uninformed simply vote for incumbent or party that might win. But this doesn’t work consistently).
Impact of social background on actual versus informed opinion
-if women were as well-informed as men, gender gaps would increase
-needs and wants of diff social groups are not the same, if consistently uninformed then they will be underrepresented.
-big change in pre-baby boomers because they were socialized in a more conservative time. This is a potential explanation. Older people probably disadvantaged on knowledge questions because they are more forgetful (answer on the tip of the tongue).
Aggregationist argument assumes impact of info is directionally neutral. More meaningful real opinion, but no connection between info and taking sides. Study of 1992 Charlottetown challenged idea that errors and random and self-cancelling. Found that info wasn’t directionally neutral. Well-informed voters voted diff and voted diff because they were well informed, controlling for education (more likely to vote yes). If people who are uninformed have diff rather than no opinions, there won’t be a self-cancelling effect.
-this is true of every relevant social group. Western Canadians most likely to vote yes, but informed divided 50/50 and uninformed were unlikely. Why? People who lack info fall back on stereotypes (stereotypes can be crude, but difficult to change).
-problem bc poorly informed responded differently because of the way they used shortcuts.
Low info rationality argument: people can make up for lack of info by using informational shortcuts.
Many sorts of info shortcuts have been suggested (best used sparingly):
- Party ID: if you identify with party, can take cues from party. Is this rational? No, because in brokerage policies parties change. Party ID serves as a running tally, and as long as party performingly acceptably they will keep their party ID, if not, they will defect. But this implies paying attention, so not a shortcut. If someone doesn’t know much about issue anyway, unlikely it will shift their vote choice. For Party ID to be a rational shortcut, need to have at least some info.
- Reward and Punish calculus: vote your pocketbook. Economic voting. Voter could simply be rewarding govt for good luck, or punishing for bad luck of being in power when economy doing badly. Can also create perverse incentives for govts to manipulate fiscal levers to get shortterm economic good times before elections.
11/09/06 - Feelings about salient groups: this is particularly relevant when forming an opinion about a particular policy. Target of this policy is people on welfare, how do I feel about ppl on welfare? The problem of relying on feelings is that they often rest on stereotypes, which are quite resistant to change.
- Take cues from agenda sectors or interveners: (ex: Brian Mulroney in CUFTA as an agenda setter) Intervener takes a position once policy is out on the agenda (ex: President of Women’s federation etc). Strategy in 1988 for Lib/NDP was “how do you feel about agenda setter?” to cue into negative feelings about Mulroney. Problem: if people don’t know enough about politics to vote, they won’t know enough to identify intervenor’s. (Trudeau speech saying not good for Quebec in 1992 caused overnight drop in support in ROC for the Charlottetown accord). Interveners only help people who know something, not people who know nothing. Blatant opposite of the theory people who know nothing can’t use shortcuts. Must be aware to know something was said, who said it, what was said and use the cue.
-visible cues aren’t really that available. Trudeau’s Maison Eggroll is an exception. - Fred Cutler argument: Demographic similarity to party leader. Problem: can you assume on the basis of demographics that share same ideas. (this doesn’t mean that people don’t do it, even well-informed people do). People have more than one social identity, which pull us in diff directions. Other problem is that demographic characteristics assume some knowledge. Gender and region is usually known to people. Religion is unknown and unimportant.
-info shortcuts are about making the info you have go further. Popkin emphasized this: not panacea for people who know nothing, must have some info to understand & make use of cue.
-shortcuts were imported from cognitive psychologists (and they aren’t very optimistic about them. Using peripheral, not central processing in our brains, thus not paying much attention.) relying on rough rules of thumb that may let us down.
-using shortcuts is a matter of faith. How do you know if they worked? Not a conscious process, people don’t go validate their shortcuts.
-when people rely on shortcuts do they reach enlightened choices? Or, do feelings substitute for ideas? Feelings can only substitute for ideas if 2 people who are otherwise similar have diff levels of info & feel the same way.
-found that feelings matter when ppl make decisions, regardless of how well-informed people are. Effect of feelings about Quebec held across all info levels in 1992. In ROC, the more positively felt about Q, the more likely to vote yes. In Q, the more positive felt about Canada, the more likely to vote yes. How do you explain this? ROC more informed are aware that Q often treated as 2nd class in their own province, history. In Q, more informed recognize large changes in Canadian federal system.
-what differed according to info was how positively or negatively you felt.
-people who were well-informed factored in things other than feelings. Number of considerations.
Info shortcuts do not necessarily enable people lacking info to make the enlightened choice.
Who Abstains from Voting and Why? VOTER TURNOUT
Concern about declining voter turnout. 2004 hit historic low at 60.5% Between 1988 and 2004, turnout plummeted 14-15 pts. 1988 was average for postwar elections, not very high (75%). 2006 went up to 65%, but still 10 pts below the postwar average. (this is based on registered, not eligible, voters).
Does this matter? If people weren’t happy, they’d come vote, so it’s a vote of confidence. Other people see declining turnout as the proverbial canary.

Explanations for Voting Apathy
- Boring: the elections themselves are boring, not very competitive. People are more likely to vote when they think their vote will make a difference, ie, when the election is close. No big issues at stake.
Positive: 1995 Referendum had 93% turnout, which is stunning, something was at stake and it was close.
-data supports idea that less people don’t vote because they think it doesn’t matter when election is close.
Maybe 2006 had more turnout than 2004 because Libs had an incumbent minority, so knew they could be beaten. In 2004 incumbent Lib majority, so didn’t seem like it was that close.
-relationship between closeness of the race and turnout isn’t strong. 1988 landslide had higher turnout than later close elections
-draws on rational choice argument: only worth voting when benefits outweigh expected costs. Probability that your vote will be decisive. It is irrational for most people to vote.
-when leading parties are neck & neck, turnout on av is 3% higher. People think race is closer than it is because of party ID.
Why isn’t relationship closer? Why vote? Pressure from within social networks. Duty. In 2006 49% of people said they voted because of duty, 30% to make a diff, 15% liked leader/candidate.
Andre Blais study (to vote or not to vote): can divide electorate up, half will vote out of sense of duty. Others decide it ifs worth it.
If it’s duty, why the decline? Decline of feeling of duty. Does this break down by age? In the past, haven’t been very big.
-In 2006, maybe new electoral laws giving $1.75 were an incentive. - Permanent Voter’s list: declining turnout is due to switching from enumeration to permanent voter’s list (until 1996 enumerators would come to the door, first used in 2000. List updated through info sharing between governments & elections Canada. Can add name up to and on the day of the election). Why would the switch make a difference? Having someone come to the door might encourage to vote, remind of duty. New system puts burden on individual, not government (gives message that state thinks voting is important enough to send people around to make sure that you’re on the list)
-problem that voter decline preceded change in system.
-young people more likely to be left off the list bc more mobile; low income move more often/less money-time - Changing societies: Changing times, changing values, more access to info, less religious, more morally permissive, work lives have changes, egalitarian, open to diversity, less accepting of hierarchies.. greater expectation of being able to directly participate in decision making. Neil Nevitt says there’s been a decline of deference.
-this matters to voting: how? People who attend church more often are more likely to vote, stronger sense of duty? Social networks? Greater sense of belonging to the community? Leaders of religious group may actively encourage to vote. This effect not strong recently.
-more consequential is decline in party ID. Linked to changing values, stronger when people needed parties to make sense of politics. Now people are cognitively mobilized, educated, more access to info, no longer need parties. Secondly, these cognitively mobilized citizens are less deferential. Turn away from electoral politics towards more meaningful forms of engagement.
-New forms of engagement do not substitute for voting, but complement it. Not clear why cognitive mobilization would discourage vote… just won’t rely on Party ID.
-parties not longer as effective in getting voters out, relied on women.
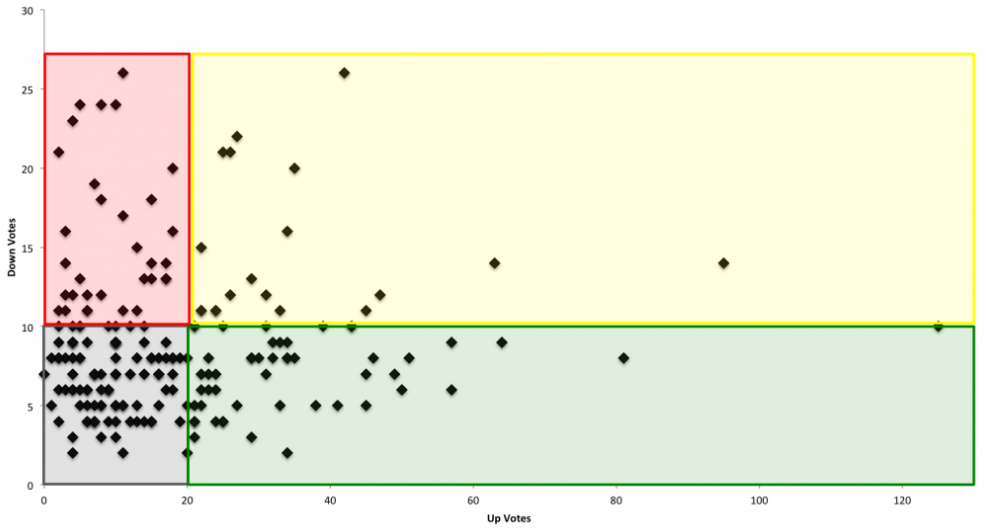
• Voter turnout: voter turnout drops heavily 2004 reached the lowest point ever, 2006 is an upward growth in electoral growth.
• These elections:
• The switch from the permenant voters list: we were looking at the changing times changing values. Nevitt: Decline of Deference: declining religiousity: most religious people are the most likely to vote.
• You have Christian Democratic parties in Europe that mobilize these people.
The Decline of Partisanship> Russ Dalton cognitive mobilization: people are more intelligent: more access in education. The percentage of people who complete high-school the big change has been there.
• You have a populace that is better educated. There is so much more access. More and more people have access to information.
• People are no longer willing to differ to political parties. People are less partisan than they were and there not as interested in electoral politics.
• They want a more meaningful way of engaging in politics.
• It’s not clear why cognitive mobilization of voting. Boycotts: buying a good for ethical reasons.
• An increased education makes a huge difference: people who are more educated are going to sign a petition. They are the most likely to vote.
• There are more options for people to express themselves.
• Education has a positive effects on all projects. Why is it that education regardless of education faculty gets them interested in politics? People have the cognitive skills and politics is complicated. You need to have higher cognitive skills.
• Education makes people more tolerant of the messiness of democracy in action: majority can’t always have its’ way, it takes time, there is compromise.
• People who have formal schooling can understand democratic participation.
• People who are more educated: people are more likely to identify with a political parties: educated people do understand that there is a difference between political parties.
• Secondly, there is little evidence that party identification is declining. Strong partisans fluctuate but it has no consistent trend downwards.
The one thing that has changed is the percentage of people who are leaners. The leaners are none partisan. The percentage of people who are leaners has decreased: there are more people who no longer have strong leanings.
• The political disaffection: the democratic melaise. There is a new concern for engaging citizens in partisan politics.
• This is the most pessimistic interpretation. People are more cynical about politicians: politicians are self-interested, they are stupid, they loose confidence in their elected politicians. If you see politics as pointless and or corrupt: you are going to be less likely to go out and vote.
Trends in Perceive System Responsiveness % agreeing the government does not care what they think.
• Canadians had a lot to be disaffected about in politics. The sponsorship didn’t disaffect:
• The decline in voting they must be happy: they are happy and when they aren’t satisfied they will vote. When Canadians are satisfied they sit on their hands.
• For every person who sits out the election: the NDP protest vote and the Reform and Alliance vote.
• There is problem of timing: political disaffection is not related to turnout.
Perceptions of Dishonesty:
• Declining turnout is difficult to link with increased cynicism: socialization: in other words people have become less active BUT people who grow up become aware of politics in which politics was held at a low esteem: the inculcation of civic norms.
• The Turnout was down
• Trends in Turnout by Age Group: the oldest
• The 1960s Generation X, 1970 Generation Y.
• There was no decline for the probably boomers virtually no decline the decline is confined to post-generation x.
• Generation Y: there is a decrease in turnout. Education doesn’t make so much of a difference.
• 1970s dropout there has been no decline in turn out in university: The university students aren’t turning their back on politics
• There has been a drop in high-school.
• The gap between University and Dropouts was 50 points. Huge drops in the age groups of dropout, college, high-school.
• If it hadn’t been for University Students: education really mattered in turnout.
• Get people in school and get them adult ed course if they get the education.
• Unions have changed as well: healthcare workers, there unions.
• Younger people are less likely to vote: younger people are always less likely. People are drawn to American politics, television, video games, internet, the decline of social capital. There is a lifecycle effect:
• Social networks are stronger in rural Canada.
• People in rural areas are more likely to vote.
• None of this is uniquely Canadian.
• Young people are less likely to become partisan who is young. The more educated. There is a life cycle problem.
• The probability of voting increases in 20and 50. The sharpest increases 20 – 30 9 points 30-40 4 40-50 2 point. Plateau life cycle effect.
• We also found a period effect: can you identify as series of events: Yes since 1988 there is a period effect that accounts for about 3 point to 2000.
• The strongest effects are generational effects 20 points.
• Young people today were much less likely to vote then their parents were.
• Turnout in the youngest age group: ten points lower for those born in 1970 for those born in the 1960s.
• According tot our estimates if the probably boomers weren’t dying off and if the post genX would be 73% two points lower than the period between 1988 – 1945.
• Why has turn out been declining for those without a university education. Social background: people are getting married later (this doesn’t matter as much). All of these things delays the life cycle effect.
• Part of the lifecycle: people’s lives even allowing for that that only explains away 7 points of the 30 points gap. We have to look at orientations towards politics.
• Are these young people turned off. Or are they tunning out.
• Young people political disaffection: young people are less disaffected with politics than older people.
• It’s simply disengagement lack of interest: Youth are re-engaging people into politics: elections are little more interesting for people.
• Radio is becoming more important in politics.
• Young people are more likely to use the internet. This is 200 younger people are more likely to use the internet to get information.
• Very few people go online to get information about politics. Party website I very low. Internet would reengage it just haven’t reengage.
Lack of interest: lack of knowledge.
• The youngest age group: 2000 Chretien had led the Liberal party to three successive leaders.
• Joe Who6 percentage: Ralph Goodale: Martin Finance Minister.
• If it was a matter of general politics: younger people know less. That would not explain why the Stockwell Day was the leader for the Alliance.
• Paying down the debt didn’t resignate
• Some people see the wrong question: young people are informed about politics: ask about topics that engage younger Canadians.
• There isn’t much data: globalization: A survey in the summit in Quebec city only 50% of had heard of globalization. Only 53% had heard about the demonstrations against the world trade organization. Only 40% knew the summit was coming up.
• All three issues: awareness knowledge was lowest in the age group.
• Contact: people in the parties trying to appeal to the political parties; young people are the least likely to be contacted by the political parties.
• When you control for life cycle: the gap persists regardless. The mythical about a the family relationship. Young people are more mobile there is a payoff for a party that does go out.
• People who are contacted are more likely to vote. It
• If you take generationalize differences the gap in turn out the gap in the postgen and genX disappears the gap .
• There is a weaker sense of duty. It seems to be duty that people of the past vote.
• We don’t have a cross time data. Pre-baby boomers said they felt very guilty if they didn’t feel quality if they didn’t vote. What’s impaired their sense of duty. Women have a strong a stronger sense of duty.
• Younger women are always are more likely to vote than men.
Liberal Party Presentations:
• The third group: is non-partisan non-voters.
• Young Canadians are non-partisan.
• Local Candidates make the difference: we use YouTube, internet get a communication. There is amble room in constitutiency> by focusing on the local candidates we can reinvigorate the party.
• Liberal Partisans, Non-Partisans, and younger post-Genx have not bee involved in the political process.
Divided by the Issues: focus on the flexible partisans and were going to focus on short-term issues.
• We have to realize that Canada is an expert on peacekeeping an employment.
• There are problems in Afghanistan: the poppy trade in Afghanistan: the poppy is the only substances that they are concerned about .
• The liberals were re-orient the liberal towards the 89% of Quebecers think that peacekeeping is the most important.
• Rona Ambrose was late for the opening conference: Harper cancelled eht EU Canada summit. The Harper government is not apply.
• Health Care: Canada will focus on it as a Canadian value: we are trying to make healthcare more accountable.
• The Conservative Elite there are older people
• Focus on Aboriginal: Kelowna, Women’s issues: is not an issue: Dion.
• If women are empower they will articulate the issue:
• Quebec is complicated: national unity issues: Quebec has been important to the Liberal Party.
• The Liberal’s have the hard federalisms. Harper is trying to get the soft nationalist position.
• Focusing on war, healthcare: and the identity of Canadian voters.
Bob Rae: Leadership
• The leader centric campaign: the party leader has major influence. It plays important: the leader is central to the party.
• There many other reasons.
• There are no major issues: Not Quebec sovereignty, the four other leaders: the leaders have always played a role in past elections.
• Leader “Biggest Short-cut of them all”: Kutler: the simplist short-cut of all: the people will take the short-cut of the party leader.
• Voting behaviour and the 1997 election. Canadian elections are shorterm: so that the leader will have a major impact.
• The issue is of priming.
• Through priming: the media can change the criteria of public issues:
• Having a leader centred campaign seems to be the most logical.
• His background Ottawa native: UofT
• Bob Rae is Anglican if he highlitghs thios will be a major challenge.
• A candidate must be from Quebec. NDP Bob Rae man!!! Flip Flop.
• He was an Ontario values: is threateneing.
• Based on Mendelsohn this popularity will drastically change.
Local Focus: Stratgery: local leaders are voice needed to reach non-voting electrate
• Priming him: need to utilize the media:
• Media: privately owne, rating concerned. Controversy, new issues, Mendelsohn/Nadeau rise and fall myth building and destroying about new leader.
• There are a negative shocks: the focus is generally negative: the viewers get decensitives by the negativity. This is going to come into out .
• Economics doesn’t play a role so retrospective: checking the pocketbooks: leadership is a viable short cut. The short-cut lack of retrospective voting.
• There are several advantages: Liberals have partisans and ideologicial positioning.
• The Conservatives are centre right.
• Since we’ll be the primary opposition.
• We won’t make an effect to get news coverage; managing the negativety.
• The Web is user driven: Wikipedia
• YouTube could be used as a cost-effective tool for the local candidates.
• Door-to-door canvassing.
• NAFTA doesn’t effect people in a tangible way.
• Targetting the younger voters; the light success of the NDP in mobilizing the youth. Mobile democracy: liberals have a lot more supporters on the ground
• The grassroots: issues: how are we going to address things. In Atlantic Canada: leftist
• The French language debates: with be an advantage. Rae is going to crush Harper.
• In Quebec downplay his Anglican background.
• Ontario: NDP premiership: it wasn’t rae’s fault:
• Flip-Dlopping Income Trust: the rising oil prices: low inflation in Alberta:
• Alberta’s growth.
• Liberals environmental policy:
• You can’t have an environmental meeting to use the chair as an attack.
• Income Trust they promised they wouldn’t change rates.
• Fiscal issue: is going to be owned by Cons but we will have the income trsut to retort.
• We wait to attack them after they attack us first. There are too many other parties that will start that.
• Atlantic Canada is going to go Conservative;
• Economy isn’t going to the biggest issue.
Grassroots funding: local candidates
Local candidate
• Afghanistan: how the mission has changed. We are going to go back to our own policy.
• Political better to have a every area not real solution: opium iridaction.
Conservatives: Presentation.
• Religion is key.
• Catholics within the main stream are more likely to support the mainstream. Ridings that are determined to support the liberals. If more Catholics vote Conservative we will win more seats.
• We could try to focus media exposure on the mainstreaming effect.
• The Protestant Conservative connection was stronger. Need to try to prime party identification BUT this won’t happen on religion. Fundamentalist and Evangelical Christians. Churches refuse to be overtly politically active.
• To try to build a protestant conservatives party would alienate people.
• Ideology
• The applicability of partisanship in Canada. There is a very strong correlation between parties and vote choice. It effects
• Thirdly it filters the media for voters.
• Class voting isn’t directly related to voting behaviour in this country.
• Conservatives aren’t at a disadvantage in union. Labour workers and right leaning parties. Maybe your position doesn’t harm the vote for some reason.
• A traditional conservative policy is that we can legitimately look at welfare funding.
• You find this with unemployment insurance.
• The notion of removing big bureaucracies: taking thins back to the grassroots.
• Media effects:
• Coverage advantage: the most powerful effect in the media is primining. It will help to determined. Afghanistan is going to hurt us: so we want to beat them to the punch. We want to prime and focus on law and order issues on our terms.
• James mentions Ignatieff will learn about them. “Ignatieff being ridiculed: Hooray!!!” Party id is likely to deprimed. We learned from Jenkins.
• Issue voting is important.
Atlantic Canada
• Economic voting theory:
• Economy is more influence by economic factors in Atlantic Canada in other regions. The liberals promised to improve unemployment.
Paying the Price? Making Sense of the 2006 Canadian Election.
• Chretien was not kidding: that the Liberal Party is the most successfully in the western world.
• For the Liberals to lose in the 2000: the Right would have to Re-Unite: short-term forces would have to be strongly against the Liberals.
• Both conditions were in Place: the Alliance and Reform had formed.
• A lot of Canadians were angry with the Liberal Party.
• What changed between 2004 and 2006.
• 1st, debunk conventional wisdom. The Liberals lost in 2004 because there was talk of change. If we look at seats there were lots of change 2006 99 to 126 in Conservatives.
• If we look at vote shares there was not wholesale change.
• Outside of Quebec the Liberals only dropped 4.4% points. 3.4% increae in the Conservatives.
• Focus on Canada outside of Quebec:
• Multi-Stage Explanatory Model:
Causal order Social background,
underlying believers and values,
Party Identification,
Economic perspective,
Issue Opinions.
Leader evaluations, leads to vote choice.
• Fred Cutler: the Leader is from the West that’s all I need to know. I’m a catholic I’ll vote Liberal.
• Each of these factors has a direct effect. If you’re a moral traditionalist: you’re probably going to like Stephan Harper.
• To have this model catches total affects. We aren’t claming that everyone goes through these stages in this orders.
• The Media doesn’t fit into the model.
• We can have some counterfactuals: what if different variables. What if the sponsorship scandal didn’t matter for example.
• The model starts with social background characteristics. Social background characteristics aren’t very important in Canada.
• Conventional wisdom says that social background characteristics change too slowly to explain the index of predisposition.
• If people are rural residents they stay as rural.
• Gidengil doesn’t think that we can ignore social background: people may not change their religious but the salience of religion can change.
• Liberal dominance: hinged on the support of two groups: VM and Catholics: these groups helped to have a boast of 7 percentage points.
• The damage was done between 2000 and 2004. The visible minorities dropped Liberal votes by 14 points.
• Visible minority vote held in 2006. 56 percent in 2004 and 2006 and 70% in 2000.
• There is also a language issue too. In 2006, the support of the liberal minorities: people who were born outside of Canada continued to vote Liberal.
• The Catholic vote dropped between 2000 and 2004 6 percentage points and then 2004 and 2006 by 10 percentage points drop.
• Catholics were as likely to support Conservative as Liberal.
• In 2006, there was no difference between Catholics and Protestants.
• The big winner in the religion stakes was the Conservative votes: almost 2/3 of Christians voted Conservative. People who believe the bible in a literal sense.
• Don’t forget that Christian Fundamentalist in Canada are 19% of the population.
• Christian fundamentalist gave the Conservatives 5.5 percentage points. But only 2.2 percentage points lose for being to religion as the Conservative. Party.
Regional Divide
• Liberals lost 7 – 8 percentage points in all three regions.
• Can they be explained compositionally: Lack of appeal in the west cost them 7 points as Liberals.
• The Liberals were down 12 points.
• In 2000, Alliance rural voters voted conservative in 2006.
• Conservatives have much greater appeal in rural votes. Conservatives have growth at about 2.5 points.
• Tories also appeal to married voters. The votes of married Canadians boosted the vote share by Conservatives.
• Married voters weren’t such a huge factor.
• C – 38 Bill didn’t register on vote choice.
• Where is the new Conservative Party; Conservatives are much closer to the Alliance. The PC vote was very little effected by social background characteristics.
• Some Alliance voters went back to the NDP in 2004…
Two key differences
• Many more PC voters had the Liberals as their second choice. The two differences between the old Alliance support base appeals for northern european descent, no longer holds.
• The Alliance appealed much less to women than to men.
THE Alliance lack of appeal to women had worked.
• Gender had much less of an influence on Conservative vote choice. Gender was a bigger factor than in 2006. The conservatives really closed the gap.
• Just for the record; the gap cannot be explained by social characteristics Gap. Views about free enterprise and views of social conservatives explains the gap in NDP voting and the gap in Conservative voting.
• If the Conservatives had as much appeal to women as men their vote would have been higher.
• If the NDP hadn’t had such an appeal to women than men it would have had a 2.2 percentage points lower.
Union Vote: The Alliance: easily out polled the NDP in 2000
• The NDP was able to double the share of the 2004 union vote.
• In 2006 NDP and the Liberal were close.
• The big loser was the NDP, the NDP doesn’t have much appeal to private sector workers. It was the Liberals that were helped by public sector workers. The NDP lost votes in private sector voters and public sector votes went down.
Finally, a non-finding:
• READ THE 2004 Article: the biggest change was the Age Gradient. The younger people were the more likely to vote NDP.
• In 2004, the NDP did almost as well with the under 35 group
• It didn’t last in 2006. The NDP lagged behind the other two parties amongst young voters: this is because of the Green Voters: Green actracted 10 of the young vote.
• The Environment is beginning to matter in electoral outcomes.
Beliefs and Values
• Canadian Voters are not very ideologically motivated: Canadians views about free enterprise and views about traditional morality: starting with the left right dimension the probability of someone voting NDP and is skeptical of anti-enterprise is highly likely to vote NDP.
• Liberals do well with the ambivalent.
• In 2004, the views about free-enterprise
• It wasn’t a big boost: it gave the NDP about one and half boasts. Views about Canada US relations.
• In 2004, anti-Americanism. The most positive with US the more they think that the FTA was a good deal and
• On average Canadians views are positive. The Liberals shouldn’t play the Anti-Americanism card.
• The conservative vote share would be 4 points lower.
• The Liberals could have picked as much as three points.
• Gender roles and sexual orientation is important.
• The more conservative people’s views the more likely they will support the Conservatives.
• It cost them 4.5 points the gains on Canada US were lost by the perspective that the party is conservative.
• Cynicism: disaffection with politics had little impact on the Liberal vote share: despite the Sponsorship and the Culture of Entitlement. It certainly had an impact on people’s vote choice.
• People who were not going to vote Liberal were already disaffected. So they didn’t lose all that much.
• If you wanted to cast the protest vote: the NDP voting. The advent of the Reform and the Alliance became the party of protest.
• The Protest vote split between the Conservatives and the NDP.
• The protest vote went overwhelmingly to the NDP.
• Unfortunately for the NDP it didn’t make a difference to the vote share.
• The Reform and Alliance was populist. These two parties were always about returning decisions to people at the grassroots.
• The Conservatives attract voters that they are satisfied people who are frustrated in regional alienation will vote.
• The Conservative party has taken the mantel of regional alienation.
• Part of the problem with the Reform was that it was too extreme on the point of Quebec. Stockwell Day in 2000 was under-rated: he managed to distance the Alliance from the anti-Quebec sentiment.
• In 2004 and 2006, they did have an impact.
• People who didn’t want to take a tougher line: no impact on NDP voting.
• Views on accommodating Quebec didn’t have major impact on believes.
Party Identification: The Liberals Lose their ‘Head Start’
• The Liberals had four times as many partisans than the NDP in 2000.
• All the Liberals had to do is mobilize their partisans and do at least as well as the other parties among non-partisans. Get the Liberal vote out.
• Three things changed in 2004: The Liberal core was shrunken by 4 points.
• Second thin that changed” the new Conservative party had as many members as the Alliance and the old PC combined. There were as many conservative particasan as Liberal: the lost their head start in 2006.
• You can question whether people are really partisan>These people are identified by the party on the Right. We need to think about party families and not simply specific partisans.
• So you might think that the number of conservatives is correlated with the party vote not their actual loyalty: so it could change next election dramatically.
• 49 points higher that a Liberal would vote Liberal in 2006.
• The Third thing: non-partisan. The Conservatives managed to out poll the Liberals. On by just by 4 points. The Conservatives edged out the non-partisans by 15 points or percentage.
• Only 1 in 4 nonpartisans
Economic evaluations didn’t register.
• Hardly mattered in 2004: why didn’t economic considerations not matter: they matter much less when the incumbent party has a new leader. People didn’t know Paul Martin was the finance minister.
• In 2006 Canadians were ready to judge the Liberals performance. Close to half the people interviewed: judgements of people’s personal financial situation improved over the past year. The most important point; negative points to the extent of economic voting helped the Liberals in 2006. Socio-tropic evaluations trumped the egocentric evaluations. Retrospective evaluations were much more important than perspective evaluations.
• People are more likely to blame than to reward:
• Some people did reward the Liberals in 2006. The Liberals would have lost 3 points: the economy was doing well limited the defeat.
• The Sponsorship Scandal affected the Liberals by 6.5 in 2004. Despite all the revelations during the 2006 election the Sponsorship Scandal would not have mattered and they only paid a price of 3 points.
• Voters were just as angry. But their judgments of Martin were less harsh. They were less likely to think that Martin knew about the scandal. Fewer people thought he had done a very bad job. People had more confidence that he could prevent this from happening in the future.
• Did people think he was personally involved even if the Gomery cleared him of blame?
• 20% of people knew that the Gomery report had cleared him but thought he was involved anyway.
• The people who are really agree were Conservative partisans. They were partisans of the Liberal rivals.
• Another problem: who was involved in the sponsorship scandal. 70% thought it was just a few corrupt Liberals.
• People were angry but less harsh in their judgments. They blamed a few corrupt liberals.
• The final thing is non-partisans: non-partisans cared much more about healthcare than other issues. Healthcare is the first priority.
• More likely to say Health Care than corruption. The Liberals on healthcare then why did the Conservatives.
Issue Attitudes:
• Conservatives benefits from sponsorship scandal. Defense spending: only 12% favoured cuts: this helped the Conservatives.
• In 2004 the gun registry: helped the Conservatives; it didn’t have an impact on vote choice; the promise to cut the GST at 6% didn’t have influence. People weren’t impressed with the promised cut.
• Send parents one dollar per day per child.
• Close to 2/3 wanted public daycare.
• Corporate taxes few wanted to see the decrease taxes. The Reform, Alliance, Conservative promised tax cuts. It is not a winning election issue.
• In 2004, social spending helped the Liberals. The Conservatives were
• The Issue that helped the NDP was environmental spending. It does tap into the environmental issue seriously helped 2 point boost
• Gay Marriage: only 1% of people thought it was a big issue.
• Issues had little net effect.
The Conservatives and Liberals it turn out issues were into important.
• Liberals have an advantage on the issues if you remove the sponsorship scandal.
• Harper’s ratings were more negative.
• Dislike of Harper cost the Conservatives the more than dislike of Martin more.
• 60% Martin only cares about staying in power. Harper is just too extreme (52%)
• Just too Extreme? The Conservative Party and Leader have to counter the image that they are too extreme.
• 1 voter in 5 said that the Conservative party is just too extreme.
The Limits to Growth:
• The Conservatives fair very poorly in second choices.
• The electoral base us very similar to the Alliance base so if you appeal only rural, and western voters.
• The Gender Gap is widening. The Conservative partisans have a genuine party.
• Things don’t look too bad for the Liberals; they paid a lower price: The scandal will not be an aspect on vote choice in 2007 election.
• The Liberals are closer to the medium Canadian voters.
• Things look very good for the NDP but they have the problem of strategic voting. The NDP is also vulnerable to the Greens and NDP. The NDP is vulnerable.
THE END