Innovation in Retail Asset Management: 1960 to 1980
- Launch of Index Funds (Vanguard – 1975)
- Acceleration of mutual fund sales in the US first true “star manager” in Peter Lynch / Fidelity.
- 1980 – $8 billion est
- 1985 -$15 billion est.
Sold Not Bought: Role of Salesperson Compensation:
Historically: One time commission paid by investors (up to 9%)
1987 – Launch of deferred sales charge and trailers paid out of management fee of 2.5%
Front end commission: 4% upfront plus trailing commission of .5%
Backend compensation: Nothing upfront
but 1% trailing commission
Power of salesperson led to “buying business”. Sales people fueled major change in the way Retail Asset Management started.
Banks start to focus on fund sales via branches
- Growth of independent advisors – shift away from captive sales organizations (closed to open)
- Focus on stealing customers from banks
- Emphasis on US and global funds outside Canada to overcome home market bias
- First ETFs launched in Canada (TIPs)
Growth in Canadian Mutual Fund Industry (billions)
1980 – $ 8 est 1995 – $144
1985 – $ 15 est 1996 – $211
1990 – $ 25 est 1997 – $287
1991 – $ 50 est 1998 – $335
1992 – $ 67 1999 – $397
1993 – $115 2000 – $433
1994 – $125 2001 – $441
- Interest rates on GICs and bonds
- Boomer demographic / saving years
- Scepticism about CPP
- Market performance
- Media coverage
- Banks starting to focus on mutual funds (beginning with money market funds)
- Industry innovation
- Strategic Asset Allocation – STAR (Mackenzie funds only) and Keystone (include outside funds)
- Clone funds to get around the foreign content limit within RRSPs (originally 20%, later increased to 30%, then eliminated)
- Corporate class funds to allow investors to switch between funds without triggering capital gains
- Fee structures for HNW and fee based accounts
Growth of Canadian mutual fund industry assets (billions)
2002 $404 2010 – $ 772
2003 $474 2011 – $ 769
2004 $524 2012 – $ 849
2005 $603 2013 – $ 996
2006 $696 2014 – $ 1138
2007 $739 2015 – $ 1232
2008 $585 2016 – $1339
2009 $694 2024 – $2000 (Forecast)
Net sales of Canadian funds
2004 – $12 billion 2011 – $31 billion
2005 – $10 billion 2012 – $36 billion
2006 – $17 billion 2013 – $42 billion
2007 – $22 billion 2014 – $58 billion
2008 ($15 billion) 2015 – $57 billion
2009 – $ 5 billion 2016 – $30 billion
2010 – $11 billion 2017 – $19 billion (to July)
1990 1998 2011 2016
Banks 36% 29% 46% 53%
Independents 35% 53% 45% 39%
Captive / Direct 29% 18% 9% 9%
Loss in Share by Banks was due to:
- Performance
- Advice
- Internal Barriers
- Level of Focus and Priority
- Internal Conflict / Cultural Issues
Banks Made Five Key Decisions
- Ensured competitive products – shifted to packaged solutions
- Approached high value customers with dedicated branch financial planners
- Aligned incentives – implemented variable compensation / pay for performance for planners
- Deployed sales management for planner salesforce
- Incentives to activate branch referrals from front end staff
Growth of Canadian ETF assets (billions)
2002 $ 5 2010 – $ 38
2003 $ 9 2011 – $ 43
2004 $ 9 2012 – $ 56
2005 $ 12 2013 – $ 62
2006 $ 15 2014 – $ 75
2007 $ 18 2015 – $ 88
2008 $ 19 2016 – $ 114
2009 $ 31 2017 – $ 134 (August)
Threat from ETFs – Sales
ETFs Mutual Funds ETF Share of Funds
1999 .07 18 0.4%
2010 3 11 27%
2011 7 20 35%
2012 11 31 36%
2013 5 42 12%
2014 10 58 18%
2015 16 57 28%
2016 16 30 53%
Three Types of Innovation
1 Breakthrough
- Passive investing: Burton Malkiel, Princeton
- Three factor research: Fama and French, Value, Small Caps and Momentum
- Junk bonds: Michael Milken
- Asset allocation: Gary Brinson
- Stocks for the long run: Jeremy Siegel, Wharton
2 Incremental
- Income Trusts
- Income oriented offerings / return on capital
- Dividend growers vs dividend sustainers
- Low volatility funds
- Fundamental indexing / Smart Beta
- Active share
- Geographic sectors – Emerging Markets, Frontier, Japan
- Industry sectors – Technology, Energy, Pharma, Telecom, REITS
- Tax driven
- New instruments – Leveraged loans, Floating loans, Bank debt
- Market sectors – small caps, mid caps
- Market Responsive
- Fee structures
- Tax structures
- New pricing and features targeted to different segments


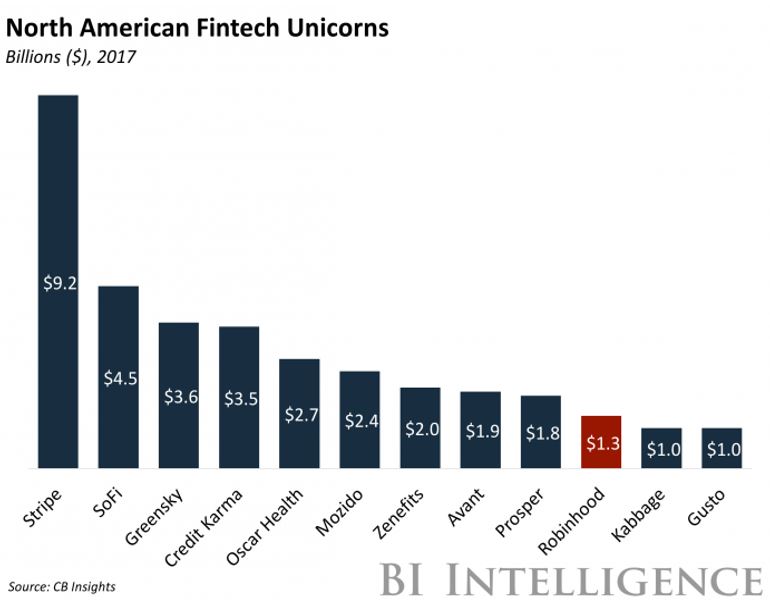
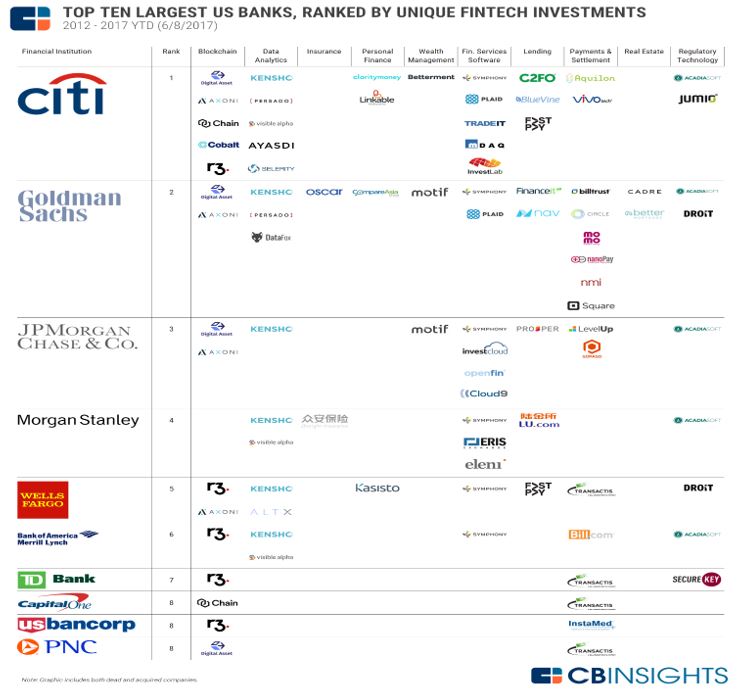
 American/Canadians banks as more risk averse: One phenomenon is that Canadian banks are hiring at a lower rate even thought the economy is in an upturn. Usually, as the economy improves banks hire more staff. However, since the credit crunch, things have changed. Banks in Canada are highly regulated to begin with and they are highly protected, they also anticipate a significant increase in competition from FinTech. Management knows that the gravy train has dissipated and disruption may be coming soon. In addition, bank management wants to be on the winning side rather than the ones rearranging the deck chairs on a sinking ship of traditional banking.