
 There are a few critical steps to engaging in Business Analysis and Valuation. In this post, we begin with Strategy Analysis by looking at Financial Statements themselves as a means of describing business performance.
Step 1 is the Strategy Analysis: What is the core strategy of the firm?
How is the kind of firm you are dealing with reflected in their financial statements?
 This work requires an understanding of the Financial Statements of the firm. What would you expect of this firm based on the balance sheet and income statement? These types of questions need to be answered using the classic MBA training test of Identifying the Firms from their Financial Statements. In order to Identify the Firms, first you’ll need to group the firms by Industry. So here are some classic industry traits.
Remember – these financial statements do not have to be from the most recent year.
- US Steel – manufactures and sells a range of steel products.
- American Insurance Group – sells a broad range of insurance products. Revenues include premiums from customers and revenues earned from cash received from customers. Expenses include amounts paid out or expected to be paid out for claims.
- Gillette – makes and sells a wide range of consumer personal grooming products. Has made a lot of acquisitions recently.
![]()
- Hewlett Packard – the firm develops, manufactures and sells computer hardware, with a large part of the manufacturing outsourced.
- Household International : A firm that lends money to consumers for periods ranging from few months to many years. A big part of expenses is the estimated uncollected loans.
- Interpublic Group : A media services firm. Creates advertising copy. Purchases ad time and space. Revenues are commissions for these services. Has made a lot of acquisitions recently.
- Kelly Services : A “temp” agency. Hires out temporary help.
- Lands End : An catalog based apparel selling firm. Most revenues through 3rd party credit card. Sells own branded merchandise.
- TJX Enterprises : Owns TJ Maxx and Marshalls – clothing stores. Sells bargain priced “famous maker” apparel.
![]()
- McDonalds – Operates fast food restaurants, both thru firm owned as well as franchised operations. McDonalds often owns and leases properties to franchisees under long term leases.
- Newmont Mining – Mines gold and other metals. R&D includes exploration costs, but can be zero if there is no exploration
- Wendys – Similar to McDonalds, but Wendys owns most of its restaurants.
So, take a look at this spreadsheet and see which firm likely matches the above….
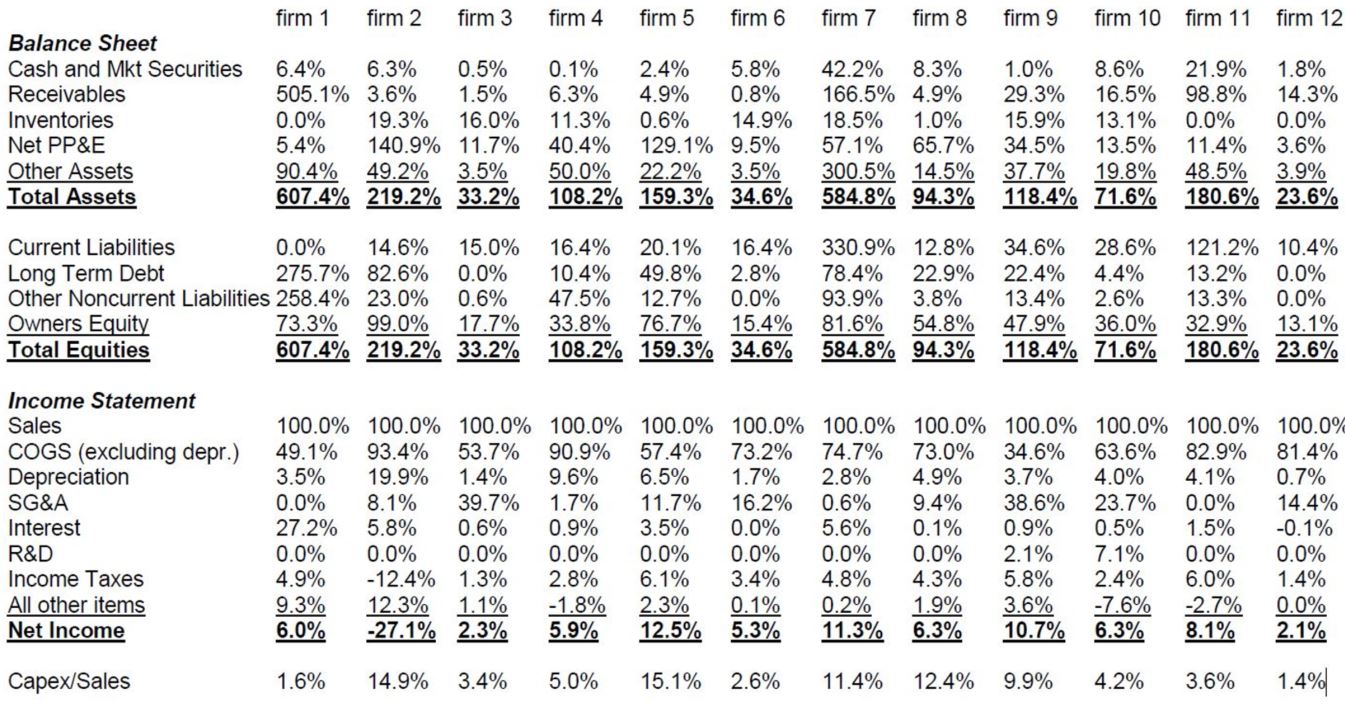
Answer Key: Identification
Start with what industry each of these companies likely works in.
- 9 & 10 R&D
- 1, 11, 12 No Inventory
- 1, 7 Receivables
- 2, 4, 5, 8 Net PP&E (Property, Plant & Equipment)
- 3, 12 no Long-Term Debt
- 7, 11 Cash/MS
- 5, 8 Inventory/COGS (Cost of Goods Sold)

Services businesses (law firm etc): (11) and (12)
If you have a high account receivables that means other firms, customer owe you money. This makes sense, you would expect the accounts receivable to be rather large, as you wait for the client to pay you. If you have high Assets number relative to sales that suggests that your balance is about holdings rather than sales.

Financial Services Businesses: 1 and 7
I would expect your Assets relative to sales to be high. Sales over assets should also be high. Financial Services also typically have a higher level of long-term debt.

Retailers : 3 Land’s End, 6 TJX
You would have marketing inventory here. Often renting space.
![]()
Branded (Supply and Retailers) (10) HP and (9) Gillette
Gillette and HP have high Research & Development costs. Branded firms also have SGA over sales ratios because they are heavily invested in advertising. If your cost of goods sold is low relative to sales that also suggests you have that markup indicative of branded goods.

Fast Food Chains: (5) McDonald’s (8) Wendy’s
Look at inventory divided by the COGS. – Fast Food are Price Setters!They have high turnover with perishable goods. They have some inventory and COGS is low margins COGS/Sales is low because of branding costs. They also have a high SGA/Sales due to advertising.
Recall that Franchising has COGS/Sales 70%
Wendy’s Owns McDonald’s Franchising
Asset 100 50 = 50
Sales 100 10 = 60
COGS 70 = 35 COGS/Sales
Assets/Sales 100%

Industrial Businesses: 2 , 4
Margin is 2%, they are “price takers/commodities” they have elastic demand. PP&E is very high in this case. The Balance Sheet should be larger than the Income Statement. They have high costs to sales COGS. Remember that balance sheets are snapshots of what I have what I owe.
You might have Ontario Mining Towns: boomtown lands 15 years, high fixed costs, risky business model. They have a lot of debt because they have assets as collateral. Junior mining companies have low equity so creditors are immense. The toughest part: Firm 2 is the mine: assets as collateral.
Upside: Creditor gets interest + principal.Down side: if the firms goes bankrupt you get the collateral. Creditors: unlike holder, creditor get small upside (capped) and a longer share of the downside.