Introduction to Futures trading
All right, so I’m really excited about this. This is my Futures Trading tutorials based on my bond trading math tutorials and utilizing Excel and other learning methods. These are powerful ways to learn, and I think you’ll get a lot out of this. We’ll start from simplistic, take it up, ratchet it up incrementally until you’re going to be really well able to understand Futures Trading so let’s get going.
What are Futures?
So, what is a future? Let’s start with that. The textbook definitions are a good waypoint for us, but I do find that academics who are really specialists in the field jump too quickly into technical jargon and detail. And I’m about to basically do that as well, but I want this to be, as I say, like a waypoint or an anchor for us. So that when we go from simple and approachable, following this, you’ll start to build up the knowledge. But it’s good to just know what you don’t know.
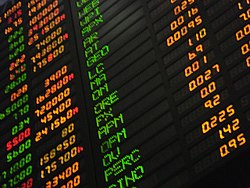
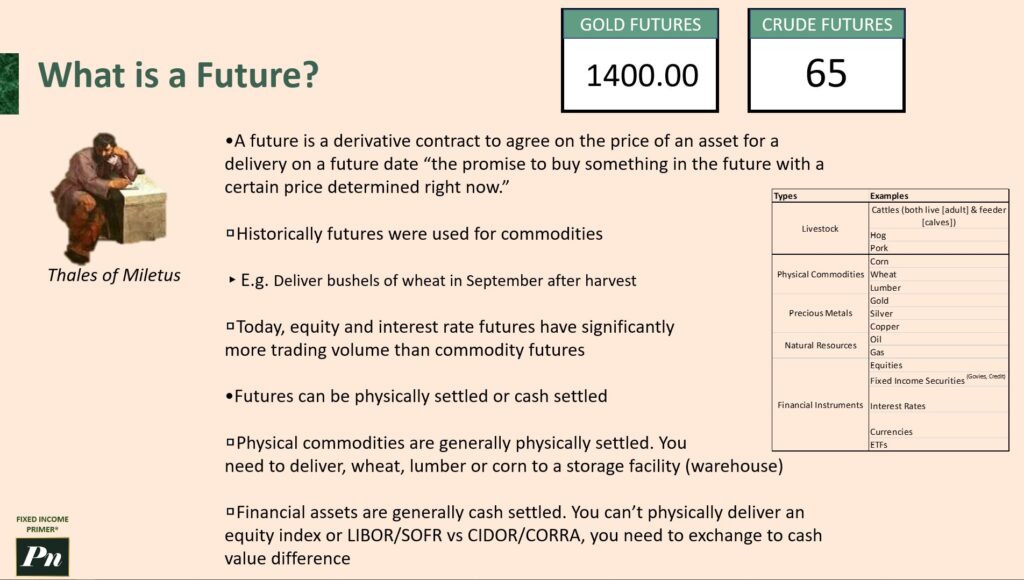
So when you turn on your cable news, you might see a ticker tape at the bottom of the screen, and you’ll have some information flowing. Sometimes it’s the e-mini Dow Futures contract or the e-mini NASDAQ futures contract. And you might see something called the gold futures or crude oil futures, and there are prices displayed there. What’s interesting, you’ll note on the day that you’re watching this cable news, is that maybe gold is actually trading at 1350, and maybe the price of a barrel of oil is actually 55 bucks or 60 bucks. So what’s going on here? What are these Futures really telling you? Well, they’re not quite magic numbers. They’re basically a collection of Futures contracts which suggest a future price for the underlying asset. Here, in this case, gold and crude oil. And that’s really helpful for people to understand where they think the price will be in the future.
So, getting back to it, just really understanding. Like, let’s say this is, uh, like I said, 60 bucks and at 65. So, the price of crude oil is going up in the future and in what time frame? Sometimes it’s the September contract, so it’s in the future. Let’s say it’s in July, September contract, so it’s in the future. So fundamentally, it’s about predicting the future and then getting a reward in exchange for correctly guessing with as much information as you can where the prices will be. And the process of doing that actually creates a fundamentally useful market, a price discovery market. And this concept of price discovery is really powerful because it helps people all around the world decide what is the value of the thing they are trying to price.
When we look at a classic definition, the future is a derivative contract to agree on the price of an asset for delivery on a future date. It’s the prompts to buy something in the future with a certain price-determined rate. Now, that’s a word salad mouthful right there. Like, what is a derivatives contract? Well, if you think about cover bands, so a rock band like the Beatles has many bands that will play covers of Beatles songs. But the covers are actually derivative of the original Beatles because they created the original song, for example, right? I was going to go so far as to say that Oasis is a cover band for the Beatles, but that’s going maybe a bit too far. The truth is that derivative really means it’s not the original or the underlying. So the point is the original is the real deal, and the derivative is the slightly removed from said real deal version of that real deal.
In financial terms, we think of derivatives as representatives of the underlying asset. In this case, it’s gold, crude oil, and we’ll show some other examples. So its value is derived from the original asset, actual gold, but it isn’t actual gold. It’s the future value of gold but spotted today. And what I mean by spotted means the now price or the current price. When people say the spot price, they really just mean the now price. So this is, again, the promise to buy something in the future with a certain price determined now. I commit to giving you at a future date this specific amount of cash for this gold.
Historically, Futures were used for commodities, and I’m going to talk about someone way back, historical person Thales. I think his name is Thales of Miletus. I checked the pronunciation of this multiple times. This is really one of the first originators of the concept of Futures contracts, and we’ll get into it, really kind of the fun story. So, what are the classic Futures contracts about? Well, there’s the delivery of bushels of wheat, for example, in September after harvest in the spring. You don’t know how the season is going to go, but you want a guaranteed price in the future for your work.
So, I also provided a table on the right here, so we can see the different types, and we’re going to go into depth on quite a few of these. The livestock, we have the cattle, hogs, and the actual meat, for example. Physical commodities, we’re going to talk about corn, wheat, and lumber, probably touch on all of those. Precious metals, gold, silver, copper. Natural resources such as oil and gas. And then we’ll talk about the financial instruments with special emphasis on fixed income, but equities, interest rates, ETFs, and currencies are also going to be discussed as well.
So, today, we’ve moved beyond these physical commodities and livestock and precious metals and natural resources. We’ve moved into the financialized markets, the equities market, for example. And equity and interest rate Futures have significantly more trading volume than commodity Futures today. And there are quite a few good reasons for that. It’s basically portfolio managers in the financial market trying to, again, support the price discovery process and the valuing of these underlying things.
So, Futures can be physically settled or cash settled. You can imagine getting a thousand bushels of wheat. You can imagine getting, sorry, a thousand barrels of oil. In particular, it’s a classic contract size. You can imagine that now handling that where it gets delivered, that gets complicated. In fact, it’s actually almost easier, we’ve discovered over time, to just cash settle a lot of these, even if it’s a commodity, physical commodities too, instead of giving and delivering a whole ton of a lot of wheat, a specific set of bushels of wheat. You would just agree on the cash settlement.
So the physical commodities, they are kind of generally physically settled, we would say. But there’s a lot to it. There’s the actual storage facility costs, getting the lumber, delivering it, all of that is all part of the process, and we’ll talk about that in depth. But the physical assets are generally cash settled. You can’t physically deliver equity index or Libor, which we’ll talk about, or Cedor in Canada, or Cora as we call it in Canada. Right? SFOR is the successor for Libor, and Cora is the successor calculation for Cedor. You need to actually exchange the cash value difference. So, you have to get the cash value right. You can’t really load up a bunch of Cora onto a truck the way you can load up wheat onto a truck. So, cash settled is the preferred for these financial instruments.
Sides of a Futures trade
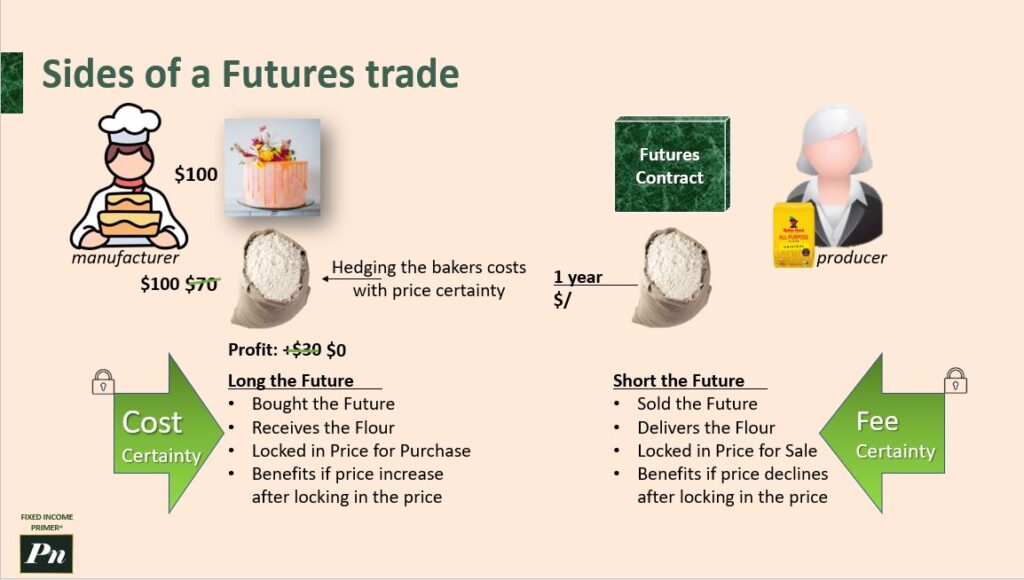
Now that we’ve got the textbook definition out of the way, let’s get into a practical example. And we’ll start with the baker, who is, let’s call it the manufacturer of baked goods. And we’re going to keep things super simplistic. We’re going to say this baker makes cakes, and the only supply item that they need is flour to make the cakes. Obviously, there’s fondant, sugar, all those other great ingredients that make a delicious wedding or birthday cake. But in this case, we’re just saying that’s it. Flour is the only thing they need to worry about, and the cake costs a hundred dollars to make, and this flour supply costs seventy dollars.
Now we’re going to ask, okay, what is the gross profit if you’re selling the cake for a hundred dollars and your variable cost for the flour, the variable cost being the cost that would vary over time based on the supply of flour, let’s say it’s seventy. So, what’s your gross profit here? Just I think it’s a hundred minus seventy, right? That’s your gross profit. So every time you sell a hundred dollar cake, you make thirty dollars in profit.
Now, suppose I don’t want to worry about the variable cost of this flour. Let’s say there’s a war in, I don’t know, Europe, for example, or the cost of flour suddenly goes way up. This baker is going to be suddenly worried about the flour. And in fact, it won’t cost, let’s say, seventy bucks. Let’s say the cost of flour actually goes up to a hundred dollars as a result of quote-unquote macro or external global factors. Flour becomes thirty bucks more expensive. Well, suddenly, this baker’s profit goes from thirty bucks down to zero gross profit. And that could be kind of threatening to the business owner’s goals. And in fact, you wouldn’t sleep very well in that case.
So, this baker has all these worries about creating and capturing market share, making sure that they have a reliable source of clients, customers that keep coming back. They make great baked goods. And now you’re also, as the baker, worried about the price of a commodity that you need to make all these baked goods. It kind of would stress you out quite a bit.
So, introducing a solution for that problem. Imagine you could lock in the price for the flour. So, the manufacturer finds someone who can supply the flour, but on a special agreement. The producer of the flour will come to an agreement through a contract that states and stipulates that they will provide the flour for seventy bucks in a year’s time when you need to replenish your stock of flour or whatever the time frame. Seventy bucks will be the static price. I agree to give flour in exchange, you give me seventy bucks, and we’ll be even Stevens on this. This will be a locked-in price and this is known as the technical term is known as the Forward Price.
Now, I think we made it pretty clear why the baker would like to do this, right? $70. Now it could go up to a hundred dollars, and there’d be zero gross profit. At the same time, though, the producer might be betting something else, that the $70 bag of flour actually might go down to $40. So, if that were the case, this manufacturer is still contractually obligated to buy the flour at seventy dollars, and the producer is still contractually obligated to supply the flour at that price. Even though in the case I just mentioned here, and we’ll show it graphically in a bit, if it was $40, this baker would like to get out of that deal. “Wow, no, I don’t want to continue that deal.” But this futures contract obligates the manufacturer to legally require them to follow through on the contract. So, it’s a kind of a beautiful system because it locks in certainty.
So now we want to touch on, okay, what’s actually the terminology here? We start to get into jargon a little bit, and I think it confuses people. But the producer would be said to be short the future. So, this “short the future” person is saying short is another way of saying “I want to sell it because I expect the price to go down.” I’m shorting the future on trading floors or in finance generally. If someone says they’re short a stock or they’re short a bond, that means they’re not bullish about it. That means they don’t think the value of that asset is going to be going up. They think it’s going down. So, they’re incented to sell the asset now because they would be shorted if they had the asset right now. They would sell the asset. If someone says the opposite, if they say, “Oh, I’m long this asset,” that means they’re holding on to it and they like the asset because it’s going up in value over time, in their estimation. So, if I say I’m short a particular stock, it means I’m selling that stock if I have any of it. And if I say I’m long a given stock, it means I’m holding on to that. Exactly the same logic applies for the bond market and fixed income as well.
And so, back to this particular example, the producer has sold the futures contract. They have to deliver the flour that’s part of the contract, and they lock in the price for sale. And this benefits if the price declines after locking in that price. The futures contract is agreed to because if the price went down, as I said, from 70 to 40, this would be a great profit situation. Gross profit situation. That’d be sixty dollars, right? If it was $40 worth of flour. But sorry, Baker, you agreed to take on this flour for certain in exchange for $70. You would get your bag of flour.
When someone said to be long the future, that’s what we’ve got with our Baker friend here. The Baker bought the future contract. They received the flour and they locked in the price for purchase. And I give seventy dollars in a year’s time in this arbitrary example. And it benefits specifically if the price increases after locking in the price by having gone long the future. And the producer is unhappy, really, because they were betting that the price was going to go down. That’s why they entered into this contract. They went short the future.
Now it is as good a time as any to pause this video. I’m not in this exact frame because obviously I have these two pause symbols on it, but pause the video and explain this whole thing to yourself. Or if you have a friend or family member in the room who’s willing to entertain listening to you explain it, explain what I just explained. And this is actually something really cool. It’s called the Define men technique. Professor Feynman, Nobel Prize-winning physicist, amazing lecturer. You learn a lot in his view by pretending you are teaching a concept to a group of students. It is actually the best way to learn, in his opinion, and I tend to agree. You end up identifying gaps in your own explanation, and you go back to the source material to better understand it. And you organize and simplify, and then transmit it to others. You know, the ideas. And it wires in your brain and understanding, and you’ll be able to better move forward because you now understand it a lot better. So let’s get into the philosophical side now.
Farmers, Producers, Manufacturers and Consumers
So what’s really happening here from a human behavioral level? As I’ve explained before, not in this series but elsewhere, that the time value of money, the value of money today is always greater than at any point in the future. Human behavior says it’s always better to have something now than at a future date. At least, that’s the financial system’s bias assumption that we prefer things now over distant into the future. Futures contracts themselves actually address this other concept of worrying and having enough sleep at night and stress. But what is that term that we typically use for it? We call it risk. We’re managing risk by basically saying, “I’m locking in cost certainty for the production of my goods and services, and the producer is locking in fee certainty that they’re going to be paid.” In this example, 70 bucks in exchange for their product, which is ground-up wheat turned into flour that they deliver to the baker. And that is even Steven’s arrangement that they both contractually agree to. It’s binding. You can’t get out of it. So it creates a system of certainty in a world of uncertainty.
So futures really have an incredibly valuable role in the financial market and in this real-world example. And I’ll explain how this is much more a real-world example than an actual Financial Futures example, but this is a good starting point. And I hope this is locking in your mind as to what’s actually going on, what are the mechanics, and some of the general terms I think we’ve covered here. Basically, this baker is hedging the costs with price certainty around this particular commodity that they need to make awesome, delicious wedding cakes, whatever cakes they do.
So wait a second, what are they? Actually, hedging against what are they avoiding? What are they worried about? What are the risks that they’re taking?
Into account and why they’re entering into this contract? Because they’re worried about it going up to a hundred dollars, particularly in the original example where let’s say there is a global war. Around wheat prices go up to 100 bucks, so suddenly zero gross profit. This is a great deal. The baker then looks “quite smart.” This would be horrible for society in general. I’d be worried about people even having weddings and birthdays or celebrating with cake. Anyway, but one of the side effects would be the price goes up.
So the baker in that circumstance would have at least one thing to be happy about. Now they don’t have to have huge cataclysmic macro events for the price to go up dramatically like that, by the way, but that’s sort of the inherent reality in finance about risk-taking. That if things go bad, you can actually generate a benefit for yourself. If things go well, you can also generate a benefit for yourself. That’s one of the powers of this technology, this financial technology that’s been developed, which is to, as maybe the word, take advantage of a given circumstance to support one’s interests using your predictive powers.
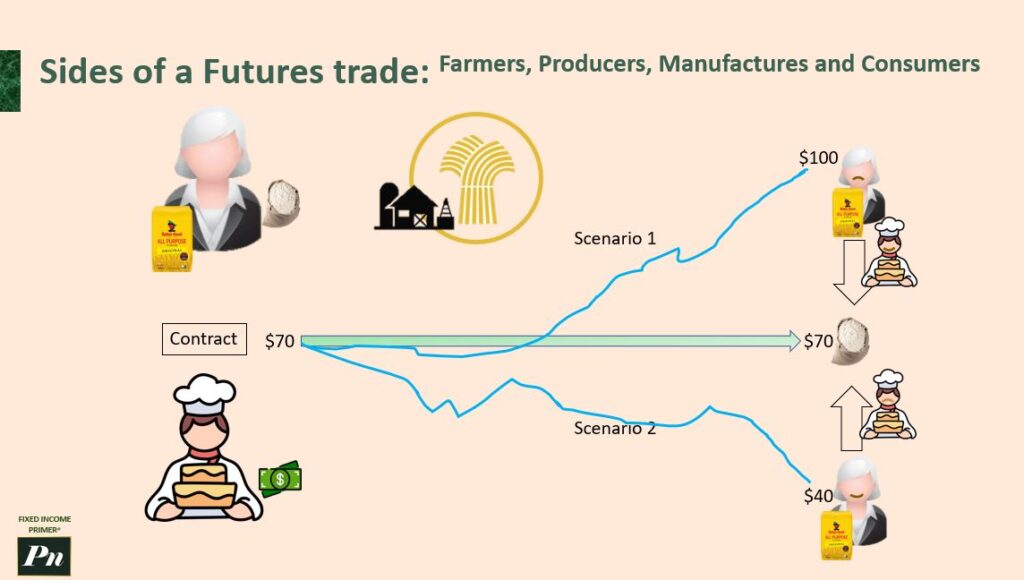
So now, just using the same example but showing it in a different visual style, we’ve got the producer again. They’ve got the flower, they produce flour. The baker has cash, they produce baked goods. They’re going to come into a contract together at seventy dollars. The producer is going to give the flower or the baker. The baker’s gonna give the money to the producer at a future date, right? And so, how do we illustrate that future date? Anytime into the future could be a week, could be a month. It could be often contracts will find are quarterly or a year. But what happens in the interim? Right, the price of that bag of flour might actually fluctuate.
So in scenario one, initially the flower’s price goes down a little bit. So the producer is really happy that that is happening because maybe it’s going to continue to go down and they can provide the flower and get 70 bucks at this point in the future. Right, it’s a pretty sweet deal if that were the case. But in scenario one, look what’s happening. Oh no, oh no, now the producer is not so happy. The price of flour has gone way up to a hundred dollars. So just pause, I’ve kind of already implied what happens here, but think about what exactly, who’s happy, who’s the winner and loser in the scenario? This person who’s short the future or the person who’s long the future. So just pause for a second and think about it.
So in this scenario one, the producer is definitely going to be unhappy with the situation. Now, why would that be? Well, because they have to deliver that flower at seventy dollars value, and they get seventy dollars from the baker when flour in the open market is actually worth a hundred dollars. So the mark to Market, which we’ll talk about what the global or local or commodity price of flour in the general market is, a hundred dollars, and yet you’re only going to get seventy dollars for the flour you’ve delivered to the baker in this circumstance. You’re not happy about that. Now, the Baker, on the other hand, who was long the contract is, in fact, quite happy, right? Because all they had to do is pay 70 rather than a hundred dollars for that bag of flour.
So now let’s consider a scenario. Scenario two: the available wheat fields double or there’s a huge amount of surplus wheat in circulation. And then there’s also the flour production. They have found new efficiencies in technology, and over the last year, they’ve made it a lot easier to convert wheat to flour. Whatever the macro or whatever activities are happening, or maybe there’s been a huge decline in the number of people who like to bake cakes (I highly doubt that, but let’s just say that were the case), then the price of flour goes down. More realistically, there’s a bumper crop, and more wheat is being produced. So there’s more supply of the commodity in the overall global market, and maybe that’s because the weather has been fantastic. It’s rained at the perfect time, the seeds were sown at the correct time, at the optimal time to produce the highest yield of wheat per bushel. All that stuff is contributing to an increased supply of this commodity, and therefore, the price of flour has dropped dramatically. That would be an example. This is also the technical term, might be a bumper crop. There’s more delivery of wheat. I’m from Saskatchewan, so you would know, growing up there, that it was always if the weather was cooperating, then it’d be a great year for the broader community, the economy itself.
So, I’ll just pause for a sec. You can pause the video and ask, “Who’s the winner and loser in this circumstance?” The person who’s long the future or the person who’s short the future, right? So the person who’s long the future is unhappy, and that’s the baker, of course. The person who’s long, this person is now getting flour. They have to pay $70 for the flour. The producer is delivering that flour, and in the open market, it’s worth $40 bucks, whereas they’re getting $70 from the baker in this contract. So, in that circumstance, the person who’s short is going to be the happier one, the one who won in this bet, in effect, or this strategic decision around locking in the price a year in the past. And now, here’s the fruits of your decision. You’re actually really making a great deal for yourself as the person who is short. Maybe you thought you knew all along that there were factors that were going to lead to the price really dropping, right? You had some insights that you felt a few people were aware of, and you wanted, and it’s not insider trading, by the way. I mean, you had insights that were divine, or you think you’re really brilliant and you have these predictive powers, and this bore out in this case.
So now we’ve talked about definitely the producer and manufacturers and their relationship. We haven’t talked about the relationship with the farmer who has the wheat and harvests it at the end of a season. The farmer is actually a really important group to understand too. They have a particular problem when the whole crop is harvested all at once. All the farmers, all at the same time, are harvesting. So suddenly there’s a huge supply of wheat in the market. If you look at it from a simplistic economics demand-supply curve perspective, you would know that that would drive down the price of wheat in the market. We’re going to see this in other examples, including in ancient times relating to olive oil. The price might be appealing for the manufacturer just around September or October, but it doesn’t have to hold all of that wheat all at once either. And in fact, it’s actually a lot easier, depending on who wants to store it, to keep the wheat in a certain location and have these contracts correspondingly obligations tied down to when they get the delivery of that wheat. And so, you can actually, and the great thing about wheat too is it can be stored all year round, so you can time when you actually have to deliver it. So, this demand-supply concern about all the wheat at the end of the season isn’t so big, but they want to hedge their risk if the price goes down. Wheat farmers always are incented to have the highest price for their commodity, and the manufacturer or producer at the flour mill has an incentive to buy it at the lowest price possible. So, this is a counterbalancing risk management tool as well because the price is balanced based on these futures contracts that create a new equilibrium for the value of the underline. So, as it’s hedging of prices and managing the risk, there’s another group of people we talked about, the farmers. We talked about the producer and then the manufacturers. Let’s talk about the consumer because they’re actually very important as well, obviously.
With the baker, you had the wedding cake. Well, that’s actually for obviously weddings, and the price of the cake we said was a hundred bucks. Well, if that price went up too high, they might be disincented from buying a wedding cake or getting another wedding cake, for example. Or the better example I think is looking at cereal. It’s a stable price across the year. Usually, General Mills will calculate out with their financial department, their variable costs, their fixed costs, how much is it going to cost to put this on a shelf, what the competitors are doing for their pricing. All of those factors are consumer-facing issues around what the appropriate price for this cereal is. And that price has to be stable over a longer period of time. And that’s way longer than the real-time adjustments to the price and the of a commodity like wheat, which is used in making Cheerios. So, futures contracts are really essential for then stabilizing what General Mills interests are, hedging the supply costs to deliver to the consumer a nice even keel price over an extended period of time because that’s what consumers demand. Consumers don’t even, you know, inflation is two percent, is happy. But if we see higher inflation, then the consumer is unhappy. And so, all these are factors, and the futures market delivers for that.
Finally, you know, another example would be that livestock market, again securing the prices for cattle. And you go to a fancy restaurant, and the price of a steak is relatively stable over a year, for example. What happens over time? Obviously, inflation, but two percent inflation roughly is kind of the goal. But in effect, the steak is at a reasonable price over a stable price over a longer period than what the financial and supply prices can muster. The supply prices can fluctuate very rapidly, and it’s in real-time over a period of an extended period of time. So, futures contracts act as a stabilizer for the pricing when it’s consumer-facing. So hopefully this way of looking at it is also helpful as a visual format. So, the previous slide and this one together, I’m hoping you locked in this knowledge. And might as well say it again, explain this to a friend or family member, and you’re going to feel really good and you’ll be ahead of the game.

Futures run deep in human history
Alright, so now let’s take a look at some clay tablets. This is a clay tablet from Mesopotamia, which is between the Euphrates and Tigris River, which is actually modern-day Iraq. Ancient civilization, and what they were doing here is quite remarkable. I called it technology earlier, and when we think technology, we think computers, all that stuff. Now, financial technology like this has been around for over 5,000 years. This tablet stipulates a forward contract, and that is the precursor to futures contracts. Farmers can agree to sell their crop in the spring to be sold in the fall at a set price. The farmer is protected by any uncertainty in terms of the outcome of the price, but the other side of the transaction could be harmed or benefiting depending on how that season goes. So, this is exactly what we just talked about in the previous section. This was exact and this was happening 5,000 years before any of us were around. And so, let’s also just reconnect to why it’s called a derivatives contract. It’s because you’re transacting cash in exchange for the underlying, or you’re basically making a speculative position.
You’re setting up a price for a commodity, and you’re using the real market price of that commodity at the end of the period to determine how much you won or lost by in terms of your committed bet at the start of the contract. These farmers would have these clay tablets to lock in the sale of their crop in the spring for that coming fall at a set price, regardless of how the market price for that crop changed between the spring and the fall. Right, they’re locked in. They have to pay the specific price they agreed to. Now I’m definitely not going to ask you to pause the video now and use this slide to explain futures because I don’t really get what this is, but archaeologists please say that this is all accounting to help describe the contract that the farmer and whoever was the counterparty agreed to in this contract. So, it’s kind of neat. So, one of the subconscious insights of all this is if people 5,000 years ago were doing futures contracts, then we should be able to figure out how these things work as well.
Thales of Miletus
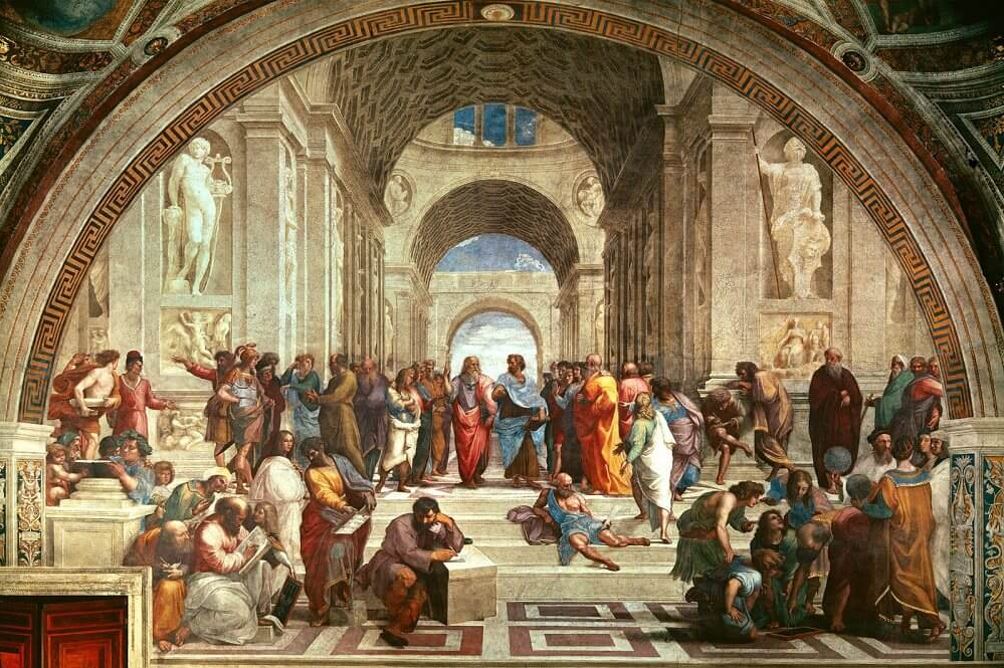
Continuing on in a sort of historical pathway here, this is a painting in the Vatican. It’s called the School of Athens. In the middle of this painting is Aristotle, and in fact, he is on a ton of textbooks. If you ever take philosophy, you’ll have seen this depiction before, and it’s showing sort of a court of all these famous philosophers are in here. And one less famous philosopher is named Thales of Miletus, and that is this dude here. We believe he was a generally poor philosopher to start. He wasn’t very successful in being a philosopher, it turned out. But he used another skill, and it was the skill of forecasting and predicting. This he was able to predict all of the harvest and get a good sense of weather patterns. And he had a fine-tuned means of understanding when would be an exceptionally good autumn for the olive harvest. So, Thales, as a result, made agreements with the local olive press owners. Okay, so what’s this thing on the right? It is an olive press. If you actually think about it for a few seconds, you’ll get it pretty quickly. You put the olives right here, and this stone rolls over the olives, crushes them, and then the olive oil comes out down here. And obviously, you kind of go in a circle. So, this is an olive press. Point here though is that Thales went to each one of these, probably fairly expensive to build local olive press owner companies, I guess you could call them. And he made agreements with them to deposit his money with them to guarantee him exclusive use of their olive presses when the harvest was ready. He basically blocked off their calendar and said, “Hey, I want to own the rights to this olive press during the autumn season.” Thales successfully negotiated lower prices because the harvest was in the future, and no one knew what the harvest would be like, whether it be good or bad that fall/autumn. And because the olive press owners were willing to hedge against the possibility of a poor yield, they entered into these agreements with Thales. And when the harvest time came and the harvest was good, many presses were wanted concurrently. Right, everyone’s like, “Alright, we got surplus, we got a bumper crop of olives, we gotta get them pressed quickly or else they’re gonna go bad.” And so, there was a huge demand for these olive presses all at once, and Thales was like, cross his arms and was like, “I’m pretty smart now, aren’t I?” He provided access to these presses, but at a very high rental rate to the olive producers. And he made an amazing amount of money in that era. I guess a drachma, probably a Greek drachma. Made a lot of money as a result of cornering the olive market, doing a futures contract with the olive press owners, and finding out a little niche, little spot, and to become incredibly wealthy. Not a great philosopher, but a great business person, you might say.
Dojima Rice Exchange
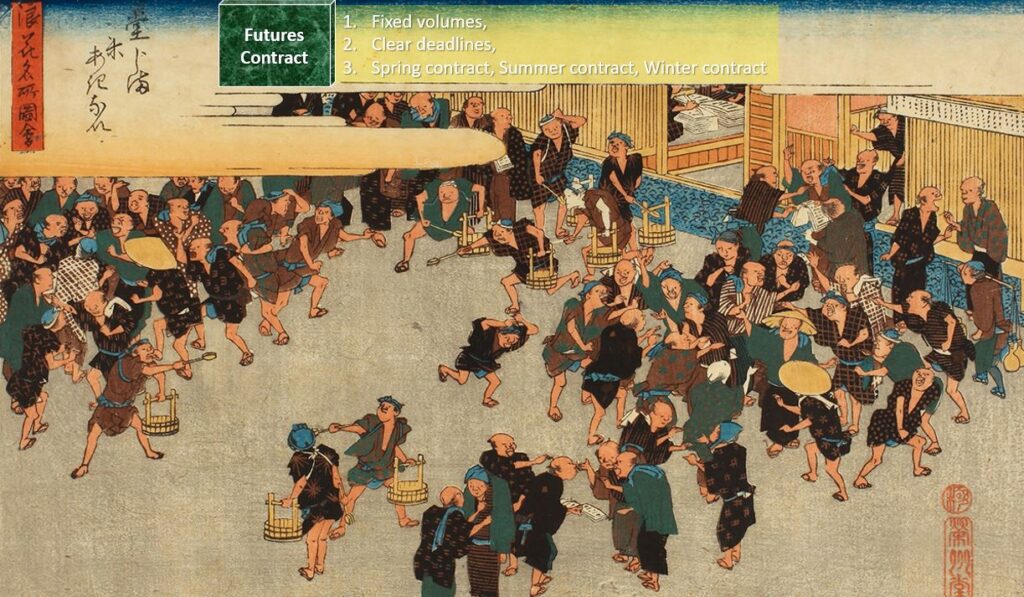
Now I promise to get onto a topic that seems a little more relevant to modern-day. But the first futures exchange market was the Dojima Rice Exchange in Japan, which was initiated in the 1690s. Originally, it was about landowners who were involved in farming and selling their rice. Farmers made money by selling warehouse receipts for the rice and transferred excess supplies of rice to Osaka and Edo merchants who bought these receipts would lend money to farmers in need in return for future rice crops. So, they started to create a kind of financial system in that way. But what really kicked things off was in 1730, futures trading started at the Dojima market with the goal of preventing long-term declines in rice prices. This allowed farmers to hedge against price changes between harvests. They wanted a guaranteed price. And so, you can see that what I’m about to describe is intuitively you should say, “Okay, this is a futures contract.” Dojima rice futures markets operated on all the same modern rules of futures trading. So, they had a fixed volume for each contract, they had clear deadlines for each contract’s expiry, and there were specific contracts. The spring contract was from January to April. There was the summer contract from May to October. And then there was a winter rice contract from October to December. And these were set tranches where those contracts existed. So, all these transactions were also entered into a book registration system, and that listed also the names of the parties, the rice volume of the futures price as well, and the delivery dates were all recorded. And here’s the key: transactions were actually settled in cash without the need to physically deliver rice between the two counterparties at the end of this trading period. And so, this was how the rice contracts really took off and futures trading really took off from Dojima.
Another really interesting thing is that samurai were paid in rice, and after a series of bad harvests, samurai realized they needed to be paid in something that was stable for conversion. And so, these futures contracts acted as a convertible to coin points as well, and they created a broader market in that sense. Then samurai, by the way, I was a big fan of Teenage Mutant Ninja Turtles, so that’s probably why I’m mentioning this. Academic textbooks also mention this, but samurais were hereditary military nobility. It was a medieval and early modern Japan from the 12th century to their abolition in the 19th century. And they were basically well-paid protection teams or warriors. And anyway, so that was just a side note. I thought it would be fun to talk about samurai for a sec.
Chicago Board of Trade
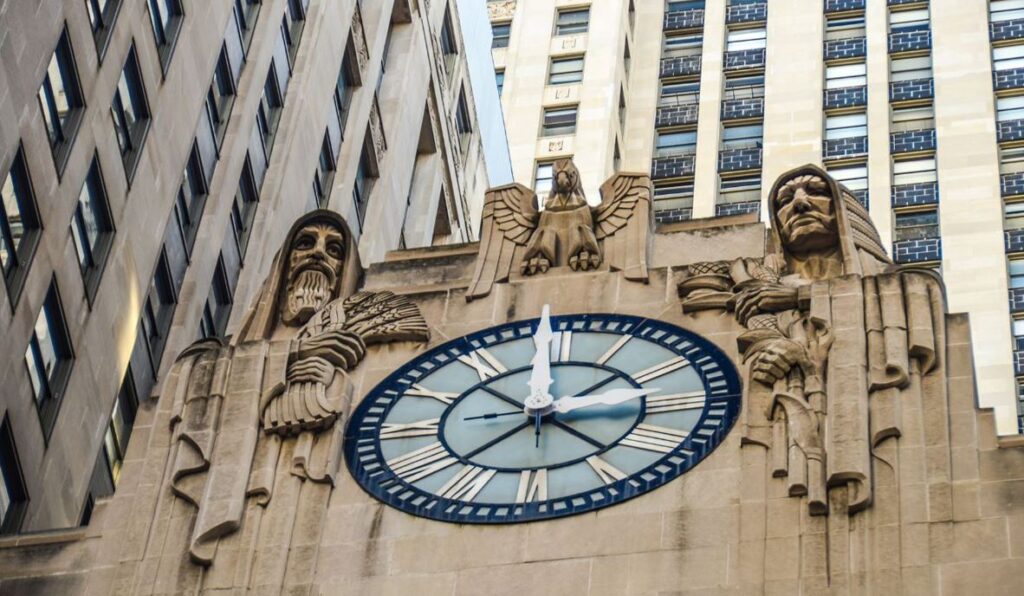
Something further on happened, and it happened in Chicago, United States, where the concepts around the Dojima Rice Exchange were brought, imported into the U.S. and used a lot of ideas from Japan were exported. And one of them was indeed futures trading, in my view. And the Chicago Board of Trade was established in 1864, and it was all centered around futures contracts. And these contracts were based on grain and livestock. It started a trend that saw these contracts created for a number of different commodities, from livestock in particular, and particularly wheat as well. And a number of futures exchanges were set up in countries around the world. This was the first one, the Chicago Board of Trade. I mentioned this now. You can actually see in this architecture there’s this guy holding some wheat, and this person holding some corn. And you can bet that corn and wheat futures contracts were indeed traded at this CBoT. It’s Chicago Board of Trade, is how it’s probably referenced. I don’t hear a lot of people saying CBoT. All in all, there’s a long historical trend that goes all the way back to, well, the Mesopotamian, all the way back 5,000 years, Thales of Miletus, to the 19th century in Chicago. And we’ll see what are the mechanics. Now, let’s dive a little deeper into a more complex example of futures trading and see if we can better understand this concept.
Alright, so now we’re going to talk about another example, this time, it’s a futures contract related to a precious metal, and that metal is gold, right? So, Trader A has a hypothesis, and that hypothesis is the following: that the economy, in this example, is going to be entering a recession. And when there’s a recession, there’s going to be also a flight to safety. And that means people will take their capital out of the equity market instead of these speculative stocks that they’ve got. They want to move their money from those stocks, convert it into gold because precious metal gold is a place that can be relatively safe against major shocks in the broader economy, etc. So, the thesis is gold is going to be vogue. It’s going to go up in value.
Gold Example, Futures trades
So, Trader A has that bias, and just to ratchet it up a bit and sort of suggest there’s more to learn in terms of how bonds, GDP, and economics all intertwine, I’ve got this visualization. If you look in the description of this course, you’ll be able to find my other courses on bond math, and we touch on the bond yield system in greater depth. But here, I want to just talk about what exactly is going on with this Trader A’s hypothesis.
So, Trader A basically thinks the business cycle is right here, approaching a new recession. And he or she notes that the bond market and the yield curve is showing signs of a butterfly shift, which is indicative of a recession. And that is where the short-term yields on bonds, the three-month bond and the six-month and one year, are really bowing downwards, they’re pushing down, shifting downwards, and longer-term yields are slightly lower. And so, you’ve basically got from an inverted yield curve situation, which is this phase three where there’s basically an overheated economy, the yield curve will start to invert in that circumstance. Now you’ve got a butterfly shift. We think there’s a recession happening. The bond market’s going to behave this way. The flight to safety in this Trader A’s view is people are going to start taking capital even out of fixed income and put it into gold.
And maybe, you know what? I’m just going to keep going here because I think this is so cool, right? So, you’ve got your yield curve. So, in a growing economy, there’s a natural shape of the yield curve. It’s upward sloping. And then, as expansion starts to happen in the broader economy, you start to see different behaviors. People start shifting their investment into the longer-dated bonds because they think it’s a safer plot space. And what happens here is when yields go down, prices go up. And when prices for bonds go up, that’s indicative of demand for those bonds has gone up, right? Because if you think of demand, if people increase demand for something, the price correspondingly goes up. And here, the yields have correspondingly started to shift downward. And then, you start to really see an inverted yield curve. So, the entire macro bond market, institutional specialists, etc., are all sort of coming to a consensus, in effect, although there are competing views. And there’s but the actual way that people spend their capital, allocate their capital is indicative of what they think. And so, that’s why the bond yield curve is such a powerful tool for people to understand how the broader economy is doing, particularly the difference between the three-month and the ten-year in the US, is the biggest, most widely used metric. So, you see an inverted yield curve when the three months yield is actually higher than the 10-year yield.
And then, we got this butterfly story, right? What would you say? I said this is a recession, and a recession is happening for sure-ish. And then, in the deep recession, the yields are driven down by a central bank dropping the interest rates or policy interest rate in Canada or the FED fund rate in the US, pushing it down. And other countries have their own term, but it’s basically the central bank’s interest rate pushes that down. And then, you start to have a normalizing yield curve as a result from going from the butterfly-shaped, which is right here, down to a return to a sort of normal-ish, and then back to the bottom of the trough, which is really one. I guess you could put the one here, and then recovery here, and then peak up there.
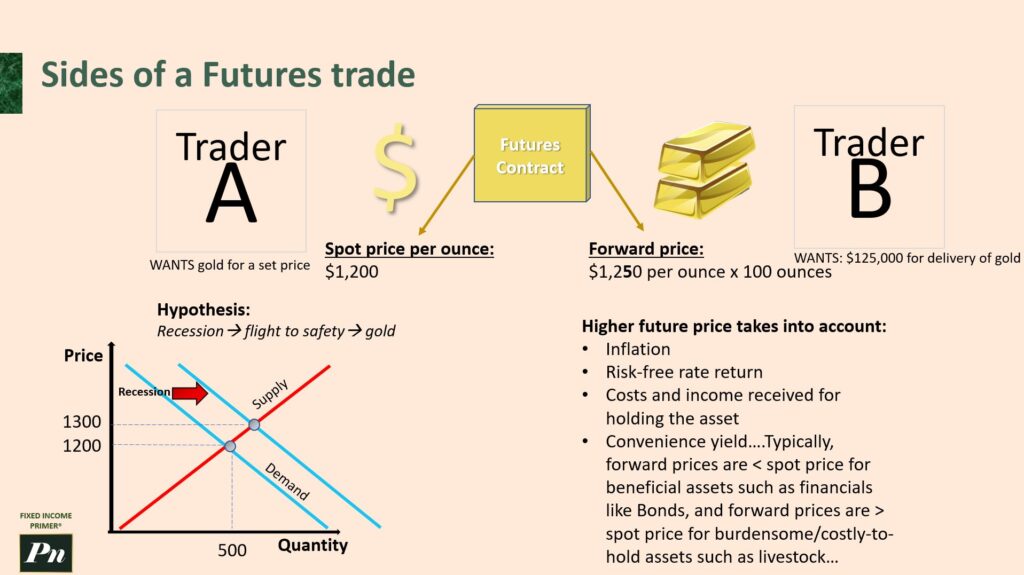
So, that was a bit of a tangent, but back to what Trader A wanted. Why is the Trader A person so bullish on gold? Bullish meaning they think the price is going to go up. Well, let’s think about it from a demand-supply way of thinking. So, this is a price and quantity relationship here, and bonds, in particular, or gold stocks, all behave under the same rubric of this demand-supply curve. Finance being a sub-discipline of economics, it makes a lot of sense that this is useful. So, what happens here is that this Trader A thinks that with regards to gold, the price is at $1,200, and that’s the current demand. The thesis is because there’s a recession, people are going to increase their demand for this precious metal, pushing the demand curve this way, pushing it this way. Supply is relatively static in gold, and so as a result, the demand curve pushes this way, pushing the price up. And that’s really the reason this Trader A thinks, “Okay, I should buy positions along on the gold future.”
So, let’s say the spot price per ounce is at $1,200. And that’s per ounce. Then, we’ll go into a forward price agreement with Trader B. Trader B says that there is a carrying cost of $50 bucks per ounce, and there’s a contract for 100 ounces. That’s the futures contract preset requirement that you have to take 100 ounces of gold. Remember, this is per ounce. So, Trader A wants gold for this set price here, commitment for this nice price, which is a good price for them. Trader B says they want the forward price that is agreeable in the marketplace, times 100 ounces. And that’s $125,000 for the delivery of this gold, which again Trader A wants to take his or her cash and turn it into physical gold because Trader A is thinking that at $1,200, they will get the equivalent of $1,300 worth of gold at a future date, right? Because the market price, this trader is anticipating, will go up. So, the value of this commodity will go to $1,300. But the spot price that they have to give to Trader B is actually only the forward price that was agreed to in this futures contract. It stipulates that the forward price is $1,250 per ounce.
Certainty of Winners & Losers in Futures
So, Trader B is going to, at this upgrade upon date, receive $125,000 in exchange for 100 ounces of gold that the trader then takes. And again, if this is $1,300 in value, the actual gold goes up in value, then Trader A has made a nice profit. Now, in this modern context, I can see how this might be a little confusing because wouldn’t it make sense then actually for Trader B to just ship away a little bit of the gold, take away an equivalent ounce or so in order to deliver the exact amount that Trader A is getting in terms of a swap from cash to gold? And no, that doesn’t make sense in this futures contract land. This is the whole point of the futures contract, as we’ve talked about it way back from Mesopotamia to the Dojima Rice Exchange, all of that. I think now, hopefully, you get that this is a bet on where the price of this commodity is going to be. And Trader A wants the certainty of a predetermined price or a predetermined amount of cash, giving cash for the asset when the asset has gone up in value. Trader A is going to be really happy. If the asset has gone down in value, Trader B, plus shorting, is going to be happy.
And so, here I just want to touch on the concept of that carrying cost. Higher future prices, a higher future price, in the prior example with the baker, the $70 bag of flour, there was the future price was $70 as well for simplicity. Now, we’re just sort of adding a little more complexity. This is that carrying cost, and that carrying cost here is that $50 extra that was negotiated as part of the forward price. So, what does this additional $50 really account for? Well, things like inflation. The contract might be a year long. In a year’s time, inflation, in a normal stabilized period, would be 2%. That’s the actual target inflation that monetary policy, global central banks have. There’s also the risk-free rate of return. I could put this capital elsewhere, and I would get a return that would be similar to $50. So, you need to pay me for this risk-free rate. And then, the cost and income received for holding the asset. So, this is the more formal convenience yield component, right? So, it’s the implied cost, and we’ll be using that word “implied” a lot. It’s the implied cost of holding a physical commodity, such as livestock, or even a financial commodity like a bond, instead of actually holding the corresponding futures contract.
It’s the underlying that you are in possession of, and it is this extra return one can earn from holding the physical commodity instead of the futures contract. So for livestocks, futures differs from bond futures in that the underlying asset is obviously a physical commodity, whereas bond futures are based on a financial instrument. And this means that in the case of livestock, the physical animal must be delivered upon expiry or expiration of the futures contract, whereas the bond futures typically settle in cash. And in this example of gold, we’re saying that it would be settled in the physical gold, but we’ll show later that it can also be settled by cash. But basically, in both, in all these examples, the convenience yield is an expression, and it’s associated with things that are more difficult to hold on to. Like, as you can imagine, you’ve got to feed the livestock, the cows have to have be sheltered, etc. So it’s typically a lower convenience yield to manage livestock than that of bond futures.
So another way to express this is to say that the convenience yield is basically saying typically forward prices are less than the spot price, typically for beneficial assets such as financial instruments like bonds, and forward prices are typically greater than the spot price for burdensome or costly to hold assets such as livestock and, in this case, gold. Because let’s face it, gold is pretty and all, and if you leave it out in the sun, apparently it will melt a little bit if it’s pure gold, and it costs to store, and you’d probably need to get a vault for it. I think you probably need to get security for it. All that’s sort of a pain in the behind, I guess you might say. And so how do you quantify that? Well, you have the carrying cost minus the convenience yield that the holder of this commodity gets 50 additional dollars to justify entering into this contract, sweeten the deal, and make this futures contract a reality.
Novation, Cancelling-Out
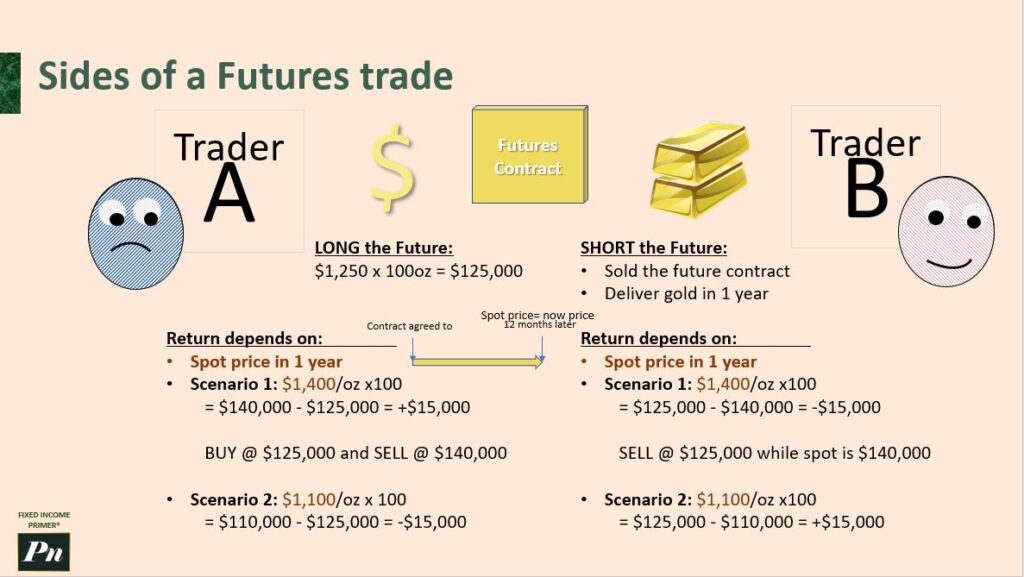
Right, so let’s ratchet up the intensity here. We’ve got Trader A and Trader B, again. Trader A wants cash, Trader B has gold, and there’s a futures contract at stake here that they want to agree to. So let’s just say in this example, as we showed in the prior slide, that convenience yield, the 50 bucks, is inserted in there. So the long futures position ends up being 125,000 for a hundred troy ounces, which is the metric for the COMEX, and the Trader B is short the future. So this Trader B has, quote unquote, sold the future contract, right? Because when you’re shorting something, you think the price is going to go down, you want to sell that thing, you want to get rid of it because you believe the value of that asset is going to decline. And if you think something is declining in value, you want to convert it into another format, i.e., sell it, rather than hold on to it. Whereas the long position, again, as we say, hold, you want to hold it, you want to buy it, you want to buy more of it if it goes up, enjoy the fact that that asset is rising in value. Okay, so this is the setup.
Now let’s think a little more, and you’re going to have to do a little pause of the video and then open up the Excel and start using Excel to help express our understanding. The return depends on what things, the return is everything in the sense that it helps to determine if they’ve done well or not. And let’s just say this contract is a year from now, it’s a full 12-month period futures contract, right? As I said, deliver gold in one year. So what’s the spot price? This is key because what’s the current market price is super critical to understand whether or not there’s a who won this in this futures contract and who’s lost in this futures contract. So you swap the money for the gold, right? You gave them the gold, Trader A now has the gold, Trader B now has the money. What’s the cash upon expiry date? What, how much does Trader A have to provide? That’s 125,000. So now we’ve got the spot price in Year One. So we’re now coming to the point in time where we’ve got to give the gold. What’s the value of the gold? The spot price for the gold is now 1,000. So what’s the notional value? So pretty straightforward here, you would just multiply this by the contract unit multiplier, right? So that’s the notional value. And what’s the difference between this value and this value? $15,000. So in this case, Trader A made $15,000. Right? So the gold and the money switch hands, and this was the scenario. And we have $15,000 up for Trader A and $15,000 down for Trader B.
And let’s look at the logic of this. This is only possible because Trader A buys at $125,000, which they were locked into again a year in the past, they were locked into, committed to buying for that price. And then they, in the real market on the spot price date one year later, they possess what is in effect $140,000 worth of gold. So they can turn around and realize this $15,000 profit if they were to turn around and sell it. Trader B is not so happy, why? Because they sold gold with the assumption that it was going to go down in price. They get $125,000 in a year’s time, but if you can go in the real market and actually sell that same gold for $140,000, but they can’t do that. They actually have to, again, this whole thing has to happen because the futures contract stipulates that the money and the gold have to swap owners. And so Trader B is indeed in a sad face sort of mood because if they were to realize this loss, in other words, if they were to go in the market to buy up gold anew, they would actually see a $50,000 gap between the money that they got from Trader A and the money they need to actually buy the equivalent amount of gold in the market, the 100 ounces of gold in the market.
So now let’s do an Excel for Scenario Two. Alright, Scenario Two is $1,100. In this parallel universe, let’s say we locked in the deal at $1,250. But in this case, a year passes, and it turns out that the price of gold has gone down. So let’s open up Excel and do that exercise.
Okay, in Scenario Two, we had $1,100. So now, let’s simply calculate the notional value. It’s going to be this times our contract unit multiplier to get our notional. And then, to get the difference, make sure you get the polarity correct. It’s the notional value at one year’s time minus the cash upon delivery amount that has to be given. Trader A, this is all from the perspective of Trader A because they’re $15,000 up and now they’re $15,000 down. Kind of a bummer.
So now, Scenario Two, as we just calculated, it’s $110,000 minus $125,000. Trader A is not in a happy mood, and Trader B is in a good mood because they’re now up $15,000 in terms of their return. They got $125,000 at the end of one year when the actual value of gold one year from the start of the contract is $110,000.
Now, let’s flip the switch here and say that Trader A is in possession of gold right now. They’re going to enter into a Futures Contract with Trader B for cash. Why would they do this? Well, they have a hypothesis. The same environment of a recession is expected, but Trader A has a new interpretation of how that’s going to play out. They believe there will be monetary and fiscal loosening. In other words, the central banks around the world and in their country, in particular, are going to lower interest rates, making it easier to borrow. The government’s fiscal decision-making is going to involve spending more, injecting more capital into the broader economy, leading to an economic surge in discretionary spending. So, buying stocks, buying luxury items, people who are already well off are going to spend more and stimulate the stock market, driving the value of even growth stocks and value stocks upwards. So, that might be a hypothesis that is viable.
So, how does this impact the price of gold? Well, everyone realizes that during this recession, things are going to actually become more attractive to invest in. People are going to put their capital into stocks and bonds, but particularly stocks, now because of this firm hand of the central bank and the fiscal decision to increase spending. So, you want to catch up before the inflation catches up. The demand for gold is going to fall because people who have gold are going to take their capital out of gold and convert it into stocks, let’s say. Trader A, who has gold in their possession, shorts the future because this person has this hypothesis just highlighted here. So, they’re going to deliver gold in one year’s time, and their bet is that gold is going to fall in value over that year.
Trader B has the opposite view. It’s a recession; therefore, the default assumption would be people go into flight-to-safety mode and they put more into gold. They buy up gold, increasing the demand for gold. So, this person takes a long position, again with that $50 convenience yield.
Let’s see how this turned out. The return also depends on the spot price in one year for Trader A, same as usual. The activity happens, the swapping animation is a real thing, it went and happened sweet. So, Scenario Three, wow, overshoot on this one. It turns out that Trader A was even wiser than it even went lower than $150. It’s now a thousand-dollar spot for gold. Everyone’s just completely given up on gold. All those YouTube channels and other advocates of gold, who, by the way, have an ax in gold, right? They have a position in gold and they want to tell you that gold is the most exciting thing you should ever buy or Bitcoin is the most exciting thing that you should ever buy. And because they have a vested interest in the price of gold going up or, for example, Bitcoin going up, if they are someone who’s big on Bitcoin, they will make any possible argument to justify convincing you to go and buy those commodities or securities. And that’s the example, you know, if it’s a rainy day, why don’t you buy some gold? You buy gold because, you know what, people are in a bad mood. It’s cloudy, and this will cheer them up. Um, it’s a sunny day, you know what, gold would be good. Crops are now getting spoiled. It’s too hot, sunny day. The entire global economy is going to shrivel up in the sun. So, let’s buy some gold. It doesn’t really matter, right? For them, they just will generate any argument to justify it. And more sophisticated arguments like the BRICS countries, for example, are de-dollarizing, and we’re all going to return to the gold standard. So, you should get gold, you should pawn your wedding rings, etc. Anyway, that’s just a bit of a tangent. Let’s focus on this. It’s kind of funny, though. Those folks are now really disappointed and have egg on their face or whatnot, and they feel bad. But they, by the way, are going to continue to have an ax to grind in gold. That’s… And so, the difference is $25,000 for Trader A. What a great move, a good bet, as it would be stated, or good speculation. And it’s paying off significantly here. They might call themselves “smart,” but in truth, there are a lot of external variables that Trader A had no control over, and the predictive power is something that no human can really have. But hopefully, they’re smart enough to get that they’re not that smart, and they don’t have that immense predictive power, that this whole hypothesis completely played out perfectly for them. Doesn’t mean that it’s going to work in the next scenario or the next scenario because future events tend to defy expectations. So, you got $125,000 out of this deal.
Trader B realizes, “Ouch, this kind of isn’t that great.” You know what? How do you want to actually settle this contract? Instead of the swapping that we saw out there, why don’t we do something different? Trader A realizes this too and figures out, let’s not bother moving the gold around. Let’s settle in cash. And this is a huge deal because if you don’t have to physically move the gold back and forth based on how the contract is structured, you’re obligated to deliver physical gold at the end of the contract. Instead of doing that, why don’t we just cancel out these parts and just give Trader A $25,000? Trader B gives Trader A $25,000 if it went the other way. Trade A, you know, let’s just pretend $25,000 that way back and forth, just settle in cash. When we’re talking about this, it’s not just gold futures that we’re talking about. We’re talking about livestock futures, hog pork futures, corn wheat futures, lumber futures, silver, copper, oil futures, gas futures, equities, fixed income, interest rates, currencies, ETFs. You name it, futures contracts. They realize you don’t actually have to swap back and forth the physical commodity. And there are stories of people who had to, you know, they didn’t do this cash transfer agreement, and they had to accept physical delivery of cattle, but they had no intention of taking on or barrels of oil, like, “Hey, where do you want me to give you your thousand barrels of oil?” Oh dear. Most people just do this settle-by-cash thing that we’re going to get into detail about. It’s really exciting and a huge step forward in this futures trading innovation.
Okay, so now let’s ratchet up the intensity a bit further because what we just realized is that you could settle for cash, and you can do a lot more that way. And you don’t have to worry about gold flying around all over the place. So let’s get into the details of how this works.
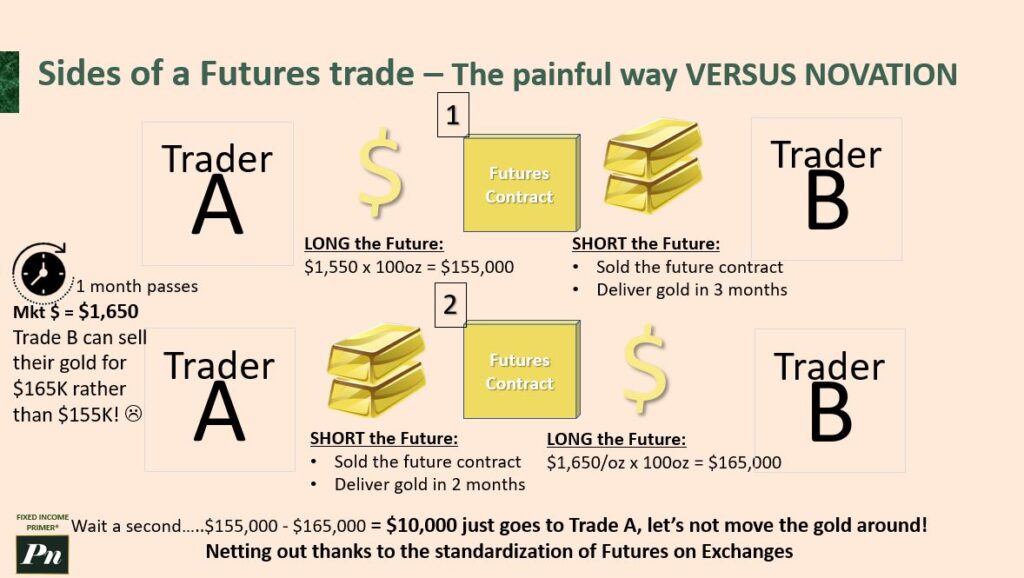
Let’s say Trader A enters into a long position of 155,000 futures contracts. Trader B wants to short because, again, I think the price is going down. But they have to deliver gold in three months. A lot of future contracts on exchanges are three-month contracts. For example, remember the Dojima example where they were doing seasonality? So spring, summer, winter contracts. Similar idea.
So this is then the situation. Trader A has entered. One month passes, and the market price, the spot price, the current price one month into this thing is $1,650. Trader B can sell their stock of gold that they have for $165,000 rather than wait an additional two months and get that $155,000, right? They’re not in a good spot right now because of that. They’re not gonna… They’re not feeling… They’ve got a sad face, is what I’m saying.
Now, what could happen actually might be a better deal. Where Trader B convinces Trader A, “Hey, how about you short this position? Because look at where we are now, it’s $1,650. There’s no way it’s going to go any higher. So why don’t you short that position?” Trader A laughs at first, “What do you mean there’s no way it’s going to go higher? Maybe Trader A,” he says, or she says, “It’s going to go to $2,000. There’s no way it’ll ever go to $2,000. Is that what you’re saying, Trader B? Come on, I think it could go higher.”
Then Trader A kind of walks away, reads some articles, and thinks about it a bit further and says, “You know what? Actually, you’re probably right. It is probably going to go down.” So Trader A then shorts the future in coordination with Trader B, the futures contract to deliver gold in two months’ time. And Trader B is long this position because they’re going to receive $165,000 at the end of two months in this scenario.
So, as per the normal and “painful” way, Trader A, the first contract, the three months has elapsed, and the gold arrives for Trader A, and the cash goes into Trader B’s pocket. Same deal with the second contract. But wait a sec, what just happened here? Basically, Trader B got $155,000, Trader A got $165,000. So the net of those proceeds is really just $10,000, and that just goes right to Trader A.
But what we also did was this expansive thing of delivering gold to each other, physical gold. We swapped gold. What was the point of that? It’s actually almost silly when you think about it. So netting out, thanks to the standardizations of future contracts on exchanges, is a really powerful tool. We don’t actually need to physically settle these. We can just net the difference of what our two positions are and walk away just with the cash transaction. Because, again, these contracts are binding.
You enter into a futures contract, you have to settle. You can’t walk away from it. And the exchange, whether it’s the Chicago Mercantile Exchange, the New York Commodities Exchange, the TMX in Toronto, Montreal, and Canada, or elseag, the London Stock Exchange Group in London, or just listing all these exchanges, it depends which exchange actually creates and manages these futures contracts.
So, the COMEX one that was gold-relevant was for the New York Commodities Exchange. They managed the futures contracts for gold that I’m referencing here. These folks create and manage these futures contracts, standardize them so that you can’t walk out of them. And if someone were to default, there’s always going to be someone else with a futures contract that could fit the bill. Someone has an ax to grind, they think it’s going to go down, another person thinks it’s going to go up. You can match these people in an exchange, so it becomes a more sophisticated and kind of beautiful system. A system where you realize, “Hey, wait a sec, you didn’t need to swap the gold between each other. All you needed to do was net out this $10,000, give it to Trader A at the end of this three-month period.” By having these two contracts live, they net each other up, and you get the $10,000 to Trader A, who was correct in their bet. And so this is where futures becomes kind of a speculative tool.
So let’s actually talk about novation of contracts. If neither party wants to physically deliver gold, they don’t need it in their manufacturing, they don’t need gold in any way, shape, or form, then you can enter into a contract such as this. You can’t rip up this contract, so it’s as real as an actual physical delivery of gold, as the same example here. I’m just saying the market price, let’s say, goes down. So in this case, Trader A is concerned because they’re going to be paying $155,000 in three months’ time to Trader B, but the gold now is only worth, a month later, $145,000. So they enter a kind of canceling out deal here where they short the future and say, “I will give you gold, you give me $140,000. I’m willing to accept that.” And so what happens is you net this out. Again, in this case, Trader B is successful.
Neither party actually owns physical gold. Let’s pretend actually just forget the whole gold symbol at all. There’s no gold being exchanged, but they are in the futures gold contract. They have netted out the proceeds, and $10,000 is awarded, yay, to Trader B in this circumstance.
So this is really a process of novation, and what enables novation is that really, in an exchange, this whole Trader A, Trader B relationship is kind of exploded. You don’t need a Trader A and a counterparty. Trader A doesn’t need to ever meet, know, or converse with Trader B or negotiate with Trader B or anything like that. And we’re going to show how, in fact, that whole construct is just an educational means to explain futures contracts.
Now let’s get a little more sophisticated and ratchet up the complexity a bit further. So if it works for Trader A and Trader B, novation can really work for hundreds and thousands of traders or anyone who wants to take an opposite position. They’ll find someone to match them with on an exchange. And that’s the key with novation. It’s really the process by which traders do not actually interact with each other at all but, in fact, settle these highly standardized contracts on an exchange that the futures contract is hosted at.
Let’s take this to the next level. We’ve got the same two traders as before. We’ve got Trader A and Trader B. So we start with the market price for any commodity. It could be aluminum, it could be corn, it could be bonds. It doesn’t matter. This is just an example. But let’s say this asset on day one is $20. So Trader A thinks it’s going to go up in price. They don’t want the underlying asset. They want to enter a futures contract. They don’t care about delivery of aluminum or whatnot. So they enter a long position of $20. And who do they have to do that with? They have to have a counterparty. Well, conveniently, Trader B is available, and they’re short $20. They think that the price of whatever this quantity is is going to go down. So that’s great. We’ve got one contract out in the market right now.
So here’s the key thing, right? If it’s $20 long, then Trader A is saying, “I agree to buy this asset in three months’ time at $20.” If you’re short, that really is another word for sell. “I agree to sell this asset in three months’ time for $20.” So here’s where things get interesting. Day two, the price of this asset is now $24. Okay, Trader A is probably thinking, “What is this good for Trader A or bad for Trader A?” Pause the video, think about it, and then unpause. So it’s definitely great for Trader A because the price has gone up. And as I said, this is the reason you go into a long position because you think the asset’s going to go up in value. Trader B is thinking, “Darn, this is not great. Um, what should I do?” It’s a situation where I’m now in a loss of $4 already. Trader A says, “You know what? I want to take out my profit right now, and I’m going to sell. I’m going to take the opposite position. I’m going to short at $24 because I want to take out the profit.” Trader B says, “I’m not interested in closing that position, right?
Because that’s not in my interest to take a long position on the $24. I don’t think the price is going to go up any higher.” Trader A is short $24, but that contract isn’t fully complete until there’s a counterparty that takes the opposite view. And now we’ve got Trader C who takes a long position. This is a third trader. There could be hundreds of traders, and in fact, thousands as well. But here we have Trader C takes the long position on $20 at $24.
Now it’s day three, and the price has gone up further to $28. Alright, so day three prices, as I said, Trader A’s closed out. Trader B and Trader C, maybe they want to take an opposite view, maybe they want to trade together through the intermediary of the futures contract and through the exchange, not talking to each other or interacting with each other in any way. So Trader C actually shorts at $28, and that’s perfect for Trader B because Trader B happens to want to close out their position, and they can only do that by going long at $28. So they’ve canceled out their positions. They can’t have two shorts or two longs or more shorts than longs. They have to have an equal amount in order to actually close out their positions.
Trader A has Trader B’s hats, and Trader C has now, let’s say, three months have elapsed, and let’s pretend the price stayed at $28 for that period, or it lands at the three-month mark at $28. So Trader A is going to get $20 for an asset that’s actually worth $28. Now they have an asset that’s worth $28, so their profit is actually going to be $4. Why is that? Because they took a short position where they have to deliver the asset for $24. So all in all, they are up $4. Trader C, same story. They took a long position of $24, and the asset went up to $28. So they have an asset that’s worth $28 in their possession, and they took a short position at $28. So all they do is they hand that over, profit or loss in that circumstance. So their total profit is $4. Trader B, on the other hand, they took a long position at $28. The current asset price is $28, so they don’t see any profit from that. But they shorted at the start with Trader A. They are the ones that deliver the $28 asset to A, and they then lose $8 in this whole deal. The key here is that there are three traders here, but you can have thousands upon thousands of traders because Trader A could do a deal with Trader G. Forget the alphabet. There’s not enough letters. There’s basically all these thousands of people that are taking opposite positions from others, and they’re speculators in terms of the underlying asset’s value. They think it’s going to go up or down. If you can find a counterparty, and by the way, when I say find, I’m not really being correct when I go to Futures exchange.
There are Futures contracts out there. The exchange is the intermediary, and we’re going to get into more depth as to how that actually works in a sec. But the key lesson here is that you don’t have to have the underlying asset to be engaged in Futures Trading, and as such, Futures Trading is a large speculative market for many people. There are also hedgers. We’ll make some distinctions about who participates in this market, but there are a lot of participants who are taking basically bets on the future of a given asset, and they’re not trading the underlying asset. They’re making these positions, they’re opening and closing positions on the asset to try to make profits. And from a philosophical perspective, the financial purpose of this is that in their participation, they are providing what’s called price discovery. They are providing the market with an understanding of how this asset should be priced in real time, and they’re committing their real capital to it in the service of their own self-interest, which is to win or lose these bets. They obviously want to win those bets or speculative positions, but in that service, they’re also providing more data points for what actually the price should be on an asset and informing decision making.
Forwards versus Futures contracts
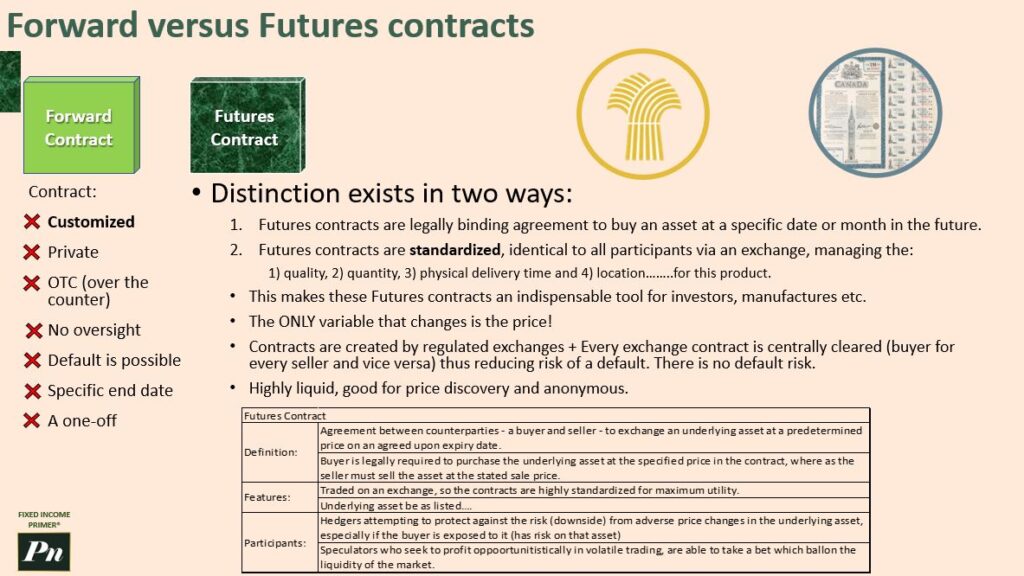
So now we’re going to talk about forward versus Futures contracts because we need to make now the distinction and just make sure that this is locked in your head and you get it. A forward contract is a unique contract, okay! It’s highly customized. It’s private. It’s over the counter or over the phone or over a dinner. You know, you can have the manufacturer of the flour and the baker get together and have lunch, and they would draft a legal document, a forward contract. The problem is there’s no oversight, and it’s possible that the baker could go out of business and not fulfill their obligation in terms of buying, giving the $70 to the flour maker, for example. In their example, we had before, there’s a specific end date, which is good, but it’s not so good in the sense that if you want to keep going with these contracts and it does end, and there’s no obligation to continue, and it’s a one-off agreement often. So forward contracts are quite narrow in their scope, and they are not exactly fit for purpose for the broader financial system. And one snag is that we talk about the forward price in a Futures contract. So don’t get those mixed up. This is a forward contract. Forward price is the price that is agreed to in the Futures contract.
Now I’m hoping by going back to this sort of textbook definition stuff, this will start to make more sense. Because we looked at some practical examples already, and now this is starting to kind of coalesce. There are two major distinctions between a futures contract compared to the forward contract. So these are the futures contracts, which are legally binding agreements to buy an asset at a specific date or month in the future. The month in the future concept will show that there’s actually a window in which you can deliver a set of bond futures, for example. Futures contracts are standardized, right?
I’m exiting out on the left all the things that are different here. Forward contracts are very, very customized. It’s identical to all futures contracts. All futures contracts are identical to our participants via an exchange, and they’re managing the quality, quantity, physical delivery time, and location of these products. And this makes this futures contract an indispensable tool because it’s so much more dynamic than just a one-to-one relationship between two counterparties, as with the forward contract. It’s kind of like when you get a student loan, you go to the bank and you have a loan, whereas a company issues new corporate debt, and then suddenly there’s this ecosystem that grows out of that where people buy and trade that company’s debt, independent of the company. It’s independent of the underlying company relationship. And you know, certainly people are trying to do that with student debt to try to create an ecosystem. But in reality, a futures contract creates an ecosystem in the same way. They have many participants taking positions, whereas a forward contract is really just two people, a dinner table agreement written in legal wording and contract obligations. Here we can have bushels of wheat that are standardized. We have sets of bonds that are standardized. The only variable that really changes in a futures contract is the price. That’s the big key differentiator. And contracts are created by the regulated exchanges, right?
We talked about the Dojuma Exchange, the Rice Exchange. We talked about the CME, the Chicago Mercantile Exchange. Basically, at its core, there’s no default risk because every exchange contract is centrally cleared. There’s a buyer for every seller, and it’s automatic. If you have a short, then someone had to take a long by definition. There’s no question about that. But the key is, with the forward contract, the baker could go out of business and not fulfill their obligation to buy at seventy dollars for the bag of flour. But here, we’ve got the central exchange taking a critical function, and they add some additional sort of tools in their toolkit to protect themselves from this risk. But the default risk is not held by the participants. There is, however, risk in taking a position on the futures contract. The highly liquid nature of it is key too, so good for price discovery. It’s anonymous, right? You don’t have to know trader A, trader B, trader G, trader E, trader 10,000. And in fact, the more traders there are, the more indicative the above the nature of the underlying asset and the amount of energy around that asset at the time. And so, you’re getting some price discovery. You’re better understanding the underlying value of this asset at that point in time. And that spot time is when people are making financial decisions on where to allocate their capital and resources. So, it’s all part of this broader ecosystem of decision-making, really.
So, this is a classic textbook definition. On the bottom of the screen, this is the one that everyone starts out learning from. And I found that this was kind of annoying because if you don’t have the context, if you don’t have a broader sense of the examples that I’ve shown, I think it has helped, hopefully, with providing a little more color than the way that they’ve done it here, which is to list out all the different participants. We’ve got the hedgers and speculators. We’ve got traders, trades on exchange, underlying assets listed. You have all these assets listed. The key is the definition.
It’s like, okay, you walk away with a definition, but then it just seems like a sentence. Whereas I want to make it more tangible for myself and yourself to better understand this topic. So, futures, now I think it’s good to talk about philosophically. It’s kind of built on this long arc of progress as we’ve suggested, bending towards over time an ecosystem of better measuring value, of ways to better measure, quantify things. And as flawed as it is, it’s actually a reflection of human nature. And we, as humans, as you may have noticed, are kind of flawed. So, this system is an expression of an underlying thing, which is how our brains work and how finance is developed as a product of that. Just remember the story, right?
Futures and other financial ideas have fun origins stories
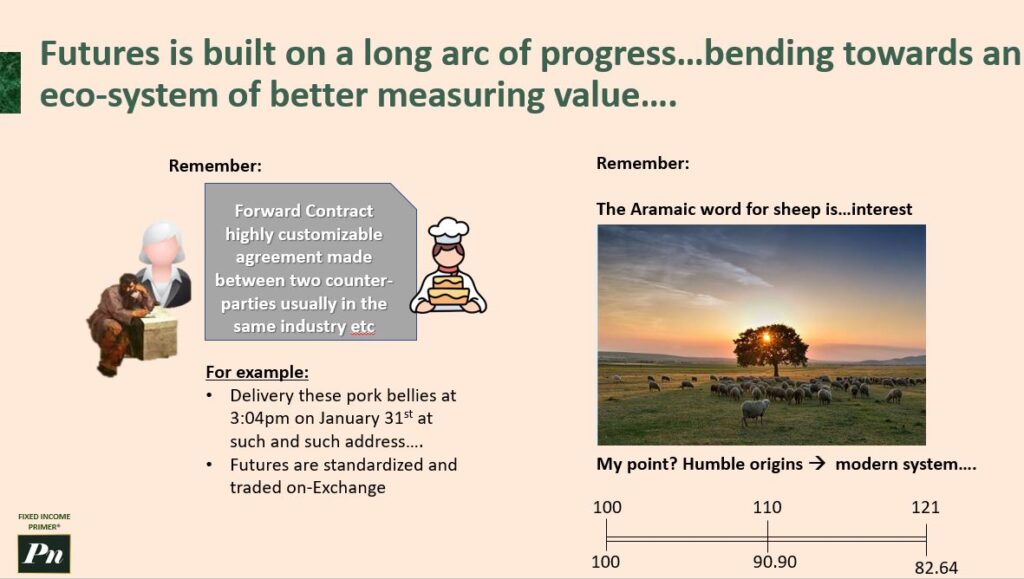
The forward contract was basically something that Thales of Miletus was using, the baker and the manufacturer, and it’s really about delivering, you know, pork bellies at a specific time on a specific date. And as we’ve said, futures are standardized. So, futures are really an expression of taking this forwards concept and really building on it. And I think it’s just worth taking a step back. A lot of the concepts in finance come from humble origins. They come from a simple place. For example, feudal lords in ancient times, we’re talking, you know, thousands of years ago, who had property passed down, probably through military victories being warlords or whatever. They had this property, and we can argue if that might be actually wrong that they had that property, and why do they have it? How do they get it? Is ill-gotten gains legitimate? Well, reality is uncomfortable. It sucks, and it’s just unfair. That’s the way the world is. These feudal lords have this property, and they lent it out to other people who can create value with that.
So, feudal lords would loan out land to shepherds, and shepherds would buy sheep and get sheep on that land. And so, borrowers had to provide some percentage of their flock of sheep back to the property owner at the end. And it might surprise you to learn that in Aramaic, the word for sheep sounds remarkably like what we use as the word for interest. The word “interest” comes from the ancient language Aramaic’s word for sheep. So, this whole concept of interest is actually just an expression of a pretty simple relationship. So, my point is really humble origins equal a modern system.
Another classic that I think I’ve already mentioned is the time value of money, right? If I have a hundred dollars today, then I can benefit from compounding interest. And if I look at the value of a hundred dollars in a year’s time, it degrades and discounts over time if I allocate it somewhere else. This discount team basically helps decision makers fully understand the costs and benefits of a specific decision and its future impacts. But what is it really about?
I’ll tell you, it’s actually about human nature. I want money now. All human beings want things now. They would prefer things in their position right now rather than at a future date. So you need to pay that person interest for giving you their money. They need to get some benefit for giving you their hundred dollar bill rather than them holding onto it themselves. It’s like, “I want an ice cream cone right now. I prefer it right now over in a year’s time.” So the whole financial mechanisms, all these things, actually come from humble origins or humble preferences. And we create sophisticated, quote-unquote, technology financial innovation or systems to really, when it boils down to it, express simple things, concepts into incrementally more complex financial technologies or solutions.
Derivatives are a huge part of finance
So really, where I’m going with all this is, because we’re going to go back and do actual bond futures math shortly, it’s a bit of a tangent, but the size of the derivatives market, all right, it’s estimated to be 1.2 quadrillion in notional value. This is an estimate of the total value of all outstanding derivatives contracts. And this can also include physical currency deposits, other liquid instruments held by households, businesses, governments, and central banks.
And my point is that the global debt markets are estimated to be about 100 trillion. So the U.S. has about 30 percent of the global debt. The rest of the world, Canada in particular, has 1.6 trillion in debt as a subset of this. So I mean, obviously, 29 trillion would be what this is, right? If there’s a hundred trillion, 29 trillion in the U.S., 26 trillion in Europe, etc. Japan has 20 trillion. So that’s a lot of debt. The global stock market, okay, it’s actually estimated to be about 91.3 trillion. And here in Canada, land, we have actual trading per year of about 1.12 trillion, and it’s growing as debts balloon.
So really, you can see that the broad money is 90 trillion, gold market is only 7.8 trillion, a 19 held by the IMF and central banks. I guess the point here is that this huge derivative space, as I just said, it’s huge. And the reason, as we can probably unpack now, I think, is that if you aren’t actually delivering the physical asset, but you are basing the outcome of the trade on that physical asset’s current spot price, the market price for that asset, you can really create a much larger speculative, you could say gambling, but speculative or hedging market that has lots of participants coming in and out of it all the time, just comparing the world’s money and markets by size.
You can go through and see, you know, the wealthiest people, the largest companies, the Federal Bank’s balance sheet. You can kind of compare all these different sizes of this money system, and it’s kind of a neat visualization. I’ll definitely cite it for you. You can take a look at yourself. But as you can see, there’s a whole bunch of debt out there, and then the derivatives market, this number is fairly different from the one I just quoted.
All derivative contracts are worth 1.2 quadrillion, so it’s a sort of a neat visualization. It’s a pretty fascinating visualization, so this is very much a futures course. But we should talk about other types of derivatives and understand their relationship. And again, we know that derivatives are a product that derives its value from something else, but it isn’t that something else.
I want to think of another practical example just to help out with solidifying this further. So imagine you reserve your right to own a condo. You buy a pre-construction condo in a building that hasn’t been fully finished yet. So you’ve reserved your spot and you’ve deposited fifty thousand dollars to do so. So you’re in the queue. And then a couple months later, you decide, “You know what? I actually want to live in the suburbs. I don’t want to really live downtown.” So instead, you phone around your friends and you say, “Hey, do you want to lift me for this fifty thousand dollar deposit? Like, I have this reserve spot. There’s a finite number of condos in this building. I know you were interested. I have the spot, you don’t have the legal right to a condo. Do you want this limited edition lakefront condo? The deposit right for access to the actual condo.” So that’s basically a derivative right.
You’re the person on the other end of that is saying, “Okay, sure, yeah, for 50k.” It’s like, “Well, actually, I just want a little bit of a sweetener too, like an additional thousand dollars because there’s no way you would have had this access without me giving it to you and selling it to you.” So that’s an example. You’re not actually trading the condo itself; you’re trading the right to the condo at a future date when it’s actually finished. So almost anything can form the underlying base for a derivative, and that’s one of the major reasons why the derivatives market is just so huge. It’s not the product itself; it’s a product that derives its value from changes in that underlying thing.
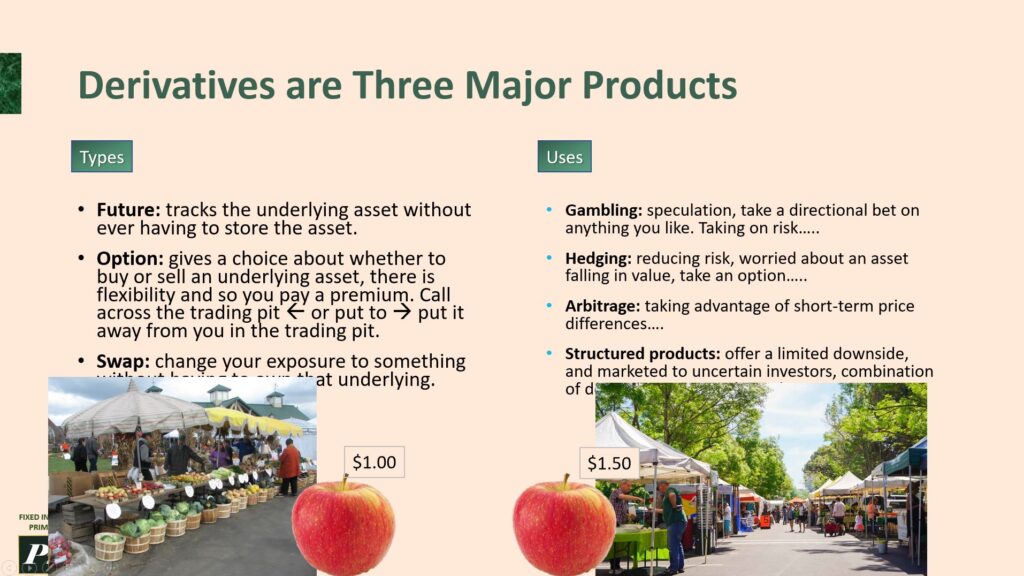
Three major products of derivatives
I wanted to highlight the three major products. So we’re very familiar with futures now, right? It tracks the underlying asset without ever having to store the asset, unlike a forwards contract. A future is traded on an exchange, but they’re essentially the same thing or very similar. Options, well, I want to talk about this just because it’s quite fascinating, and there are other courses and other big areas as well. But you’ve heard of puts and calls. Basically, it gives you the choice about whether to buy or sell an underlying asset, and there’s some flexibility there. So you pay a premium as a result.
A great way to remember what’s the difference between a Call and a Put. The real original concept was to call across the trading pit, right? In a trading pit in an exchange, call them towards you is to beckon the trader over to you to complete your call. And if you wanted to get rid of something or have a position of a put, you would put that away from you, a trading pit of what a put and call is, and now it’s all abstracted, but that was the original physically call. So bring it to you by put is sell. That’s an important another little side note.
Then there are swaps, which is sort of basically just changing your exposure to an underlying asset. So swap contracts are agreements between two parties to exchange cash flows over a certain period of time. All of these are really, really useful for a couple of reasons. The biggest one, I think, is they’re just very flexible. And in the wrong hands, they’re actually quite dangerous, and you could lose a lot of money. And I want to emphasize that as well. But there are basically these different uses. The one is sort of the speculation or gambling, taking risk, taking a directional bet on anything you like, and it’s just to take on risk. You find that unsavory, and instinctively, I do as well. We’re always making bets every day.
We’re making risks when we start a new business, when we purchase a house, when we drive our kids to school instead of putting them on a bus, when we decide Colgate versus Crest toothpaste. We’re actually making these bets or taking an informed probabilistic assessment of what is the best decision and then correspondingly getting risks and rewards. So the term “bet” is a bit more crass. Hedging is the exact opposite of gambling. Hedging is reducing your risk. So you’re worried about an asset falling in value, well then you take an option, you take a position that would offset that. An arbitrage opportunity is taking advantage of a short-term price difference.
And so, for example, if you found apples at one market, the Honey crisp apple selling for one dollar in one part of your community or town, and then you go down the road to another market, and you see that those same apples are being sold at a dollar fifty, the exact same apples, well then you would buy up all the apples in the first market, and you would go over and sell them to the farmer who’s selling them for a dollar fifty, let’s say, and you get a 50 increase, you get 50 cents on each apple. And eventually, what happens is these prices will normalize, and they’ll probably normalize to a dollar 25 each for example so that’s a concept of Arbitrage.
Structured products offer a limited downside and are marketed to uncertain investors, and they combine derivative solutions. Structured products are something to be wary of, and they are really well marketed. It’s a complex financial instrument that’s typically composed of multiple assets: stocks, bonds, derivatives, options. They often provide customized solutions to investment and risk management problems. So, structured products can be used for hedging, speculation, and to generate a steady stream of income. They can be tailored to meet the needs of the specific investor or market conditions. However, they come with a lot of hidden risks, so beware.
Speaking of risks and re-centering back on futures contracts specifically, they are very risky for first-time investors. That’s because of a thing called leverage. You can commit a small amount of capital to control a large asset through futures, and that means that small changes in the underlying price can cause large gains or losses in equal measure. We were talking earlier about forward contracts versus futures contracts, and the two major distinctions are that futures contracts are legally binding agreements and they’re highly standardized. One thing we touched on was that there’s no default risk for the individual in that there’s, in a way, that a forward contract. There is what exchanges create as a safe space to transact these contracts, and in order to do that, they have to present you with the requirement that you provide good faith deposits to be a participant. You actually have to fork over some capital to even be allowed to purchase futures. So, just reiterating what I just went over here. So, leverage allows trades to commit a small amount of capital again to command a large asset. Therefore, there’s a risk of large gains or losses in the process or before the proceeds. Futures only require a fraction to be invested by the speculator, and this concept is known as margining, as I just said, margin. The exchange requires it in order to pay for their services and cover their costs. It’s a commission in a way as well, but it also makes sure that you don’t run off and not abide by the contract.
Let’s imagine Trader A wants to do what we were doing before, which was invest in a gold futures Comex exchange. So, we have all these futures exchanges all around the world. We’ve got the TMX, LSAC, CME Group, ICE Comex, as you can see, blah, blah, and blah. All these exchanges require this margining concept. You might have an initial margin that you have to put forward. In this example, let’s just say it’s 7% of that classic gold futures contract that we had earlier. So, you’re long the future. In other words, you’re buying the right to own gold at a future date for a set price today. And that set price, in this case, is $155,000. And in order to participate in this, you had to give the exchange $10,850. If the spot price drops to $100,000, a $55,000 drop, you’ve lost $55,000 on your $10,850 deposit. So, that accounts for an over 500% loss. You have to actually bring the additional capital to cover your total loss in that case. This is a way for the exchange to make this market a living and safe market for them to operate. So, you need to put in a futures account an initial amount, and it’s called the initial margin, which is, as I said, maybe 7% sometimes, anywhere between 3% and 12% depending on what the exchange and the futures contracts are. But added to that, you also need to potentially add more money in the account because of the maintenance margin. If the performance of the futures contract goes down, you will actually need to add more money into the account in order to maintain your right to the futures contract and to be a participant on the exchange. I’m going to show you exactly what I mean by this initial margin and maintenance margin now so that this is a little more solidified.
In the previous slide, notional value was $155,000. That was the notional value, and from that, we were able to calculate the 7% initial margin. That was the amount that you had to post up, and it’s obviously just a fraction of that total notional value that the futures contract is dealing with. So, that’s another way to sort of think of the concept. Let’s take Trader A and Trader B and take a look at their relationship as it is with the exchange. Let’s say they’re trading the S&P 500 E-mini, which we’ll describe a bit later, but basically, it’s just a futures contract on the performance of the S&P 500. Each trader has to put an initial margin of $6,500 just to participate and they put it in their futures account. Now, that’s the amount they have to start off with to be players in the game. And then they also have a maintenance margin, which is to say that if the notional relationship between the notional value and the percentage initial margin drops below a certain absolute number, there will be a margin call, and the trader will have to post up more capital to keep participating. We’ll show this in a more vivid example here. Let’s just say one basis point of the S&P 500’s performance is equivalent to $50. So, you’ve got this one point equaling $50 for argument’s sake. Now, the S&P 500 is a number that helps people instantly see how well the overall market is performing. And the S&P 500 actually measures the stock performance of the 500 largest U.S. publicly traded companies. The point value reflects the total market value of all these stocks, which is calculated by adding up the current market prices of each of the stocks and then dividing by that total number of stocks. And it generates this number. So, at the start of the day on this given day, it was 3,805. At the end of the day, it was 3,800. So, Trader A, who’s in the E-mini for this contract, long on it, has lost 5 points on this thing. So, what does that actually calculate out to in terms of a loss on the day? Well, it’s $250. Trader B gained $250 because remember, if Trader A is long, Trader B here is short. It doesn’t have to be Trader B; it could be Trader 3000. But the point is, it’s a trader who has gained on the short position, $250. So, how does that actually impact the futures account for these two traders? Well, we have to debit $250 from the $6,500 initial margin that Trader A has on file, and then we have to credit $250 to Trader B, who has $6,750 now in their futures account. So, their balance at the end of that day, remember, at the start of the day, they had the initial margin. At the end of the day, Trader A now has $6,250, and Trader B has $6,750. And that’s how the next day’s trading will start, and the exchange will evaluate the current situation of each futures contract holder based on the performance of the previous day and continue based on the existing margins they have.
Its day two, and Trader A might be a little worried because they’re halfway down to hitting their maintenance margin, which is $6,000. Trader B is very happy with exceeding their initial margin, so they’re up on this whole contract now. The same rule applies: one point equals $50. The start of the day, it was 3,790, and it goes all the way up to 3,810. That’s a 20-point gain. So, what’s that look like? $1,000 up for Trader A and $1,000 down for Trader B. So, Trader B went from $7,250, and now their final balance is $6,250, whereas Trader A’s final balance is $6,750. So, if you look at the performance on this futures contract, because the initial margin, the margin call issue, was a Trader A issue with the exchange and their broker, nothing to do with the actual futures contract, the actual performance is 6,750 divided by 6,500, which is a gain of 3.8%, and 6,250 divided by 6,500, which gives us a negative 3.8%. So, an equivalent gain and loss. As with all futures contracts, it’s a zero-sum speculative exercise. Now you get a sense of how futures margins work. It’s a very risky game to be playing, so you have to pay attention depending on the specifications of the futures contract. You want to pay close attention to what your obligations are on a daily basis if it is required to do mark to market, for example, and this is an example where that is the case.

Why mark to market matters
This mark-to-market concept is really important because this is a bond futures training course, so we want to tether back to what we’re actually focused on in the end, and that is this over-the-counter market known as the OTC or over-the-counter market. It’s a very historically opaque market in fixed income. So, you would have two participants, a sell-side and buy-side participant, basically coming together and signing a contract and trading bonds for cash or whatever the transaction was. It’s become more electronic over time, but it’s definitely lagged over the equity market, which is highly liquid and highly transparent. This is more of an opaque market. So, what’s interesting is that futures can help with increasing the transparency in this market. But first, let’s understand the fixed income ecosystem.
Governments, corporations, and people all need debt to a certain extent, whether it’s student debts and loans, for example. Corporations issue corporate bonds, governments issue government bonds, and then they get the actual capital, cash, in exchange for issuing those bonds, and they go to the buy-side eventually. Well, they issue them through dealers, but the buy-side itself, all these different types of folks buy the securities from the sell-side: dealer brokers, investment banks. And there are all these different security types. This is actually not a full list, but the point is that it’s a fairly opaque market. You don’t just go and buy bonds yourself readily and easily. It’s more of an institutional market, and that’s why it’s relatively arcane or not well understood by the general public. And that’s why democratizing this knowledge, I think, is really of value. So, let’s get to the details.
The FTSE Russell in Canada and the UK has a FTSE, as well. They are always seeking to have indices to create a daily settlement price at the end of the trading day. So, you do all your bond trading, and then at the end of the day, there is a set price for each security that would be very transparent. And that’s how we attempt to evaluate the performance of our asset managers. If you give some asset manager, if your pension has an asset manager, well, they are evaluated on their performance. Let’s say they have Q3 performance of 3.1%. How do you actually know that? Well, in Canada, here we have the FTSE Russell Canada Universal Bond Index, which has a collection of viable corporate, government, provincial bonds in an array. And the asset manager has outperformed it by, in this case, 50 basis points. But how do you know that? Well, they have all these bonds. I just have three here for simplicity, one, two, and three, but there are roughly thousands of bonds. And the asset manager will weight them differently from the way the index weighs them. So, the index weighs them as 33.33% each. So, 100 divided by three is 33.33333 into infinity.
So in this case, though the asset manager might have waited for a particular type of bond higher and another type of bond way lower to get this outcome, they’ve overweighed the index weight and underweighted these ones. So that’s how they evaluate their performance on a daily basis in the bond market, which is fairly opaque. So, bringing it back to the Futures market, futures have an official settlement price, the final daily settlement price for all participants. That’s what makes the Futures Market unique, is that the daily mark-to-market prices of all futures are publicly available, and all the calculations are made publicly available.
And the final daily settlement prices are the same for every person, which is amazing. The mark-to-market has always been a feature of this Futures market, and before reforms in the over-the-counter market, recently, it was very opaque, and people didn’t know, and to a certain extent, they still don’t really know. However, the Futures Market has led the way. Individual contracts may have slightly different settlement formulas, but the methodology is fully public, and that’s made public so everyone can calculate it. And so, in the actual TMX contracts for a given security, here’s the CGB, which is the 10-year Government of Canada Bond Futures. The calculations are made available and detailed in how the entire bond works. The Exchange actually calculates out the final daily price settlement price. So that way, the broker can calculate the profit and loss performance from the previous day. The broker will make appropriate debits and credits in your account accordingly.
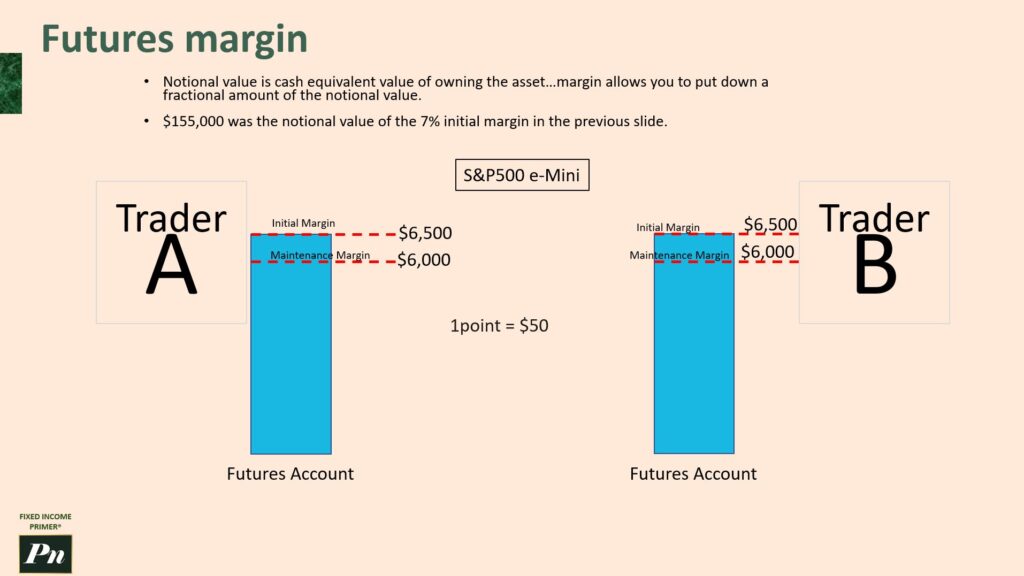
Futures margins
If you, for example, as we showed, breach your margin and have a margin call, so no cap losses are carried over from the previous day, they just have to clear at the end of the day. So, if your daily losses go below a certain threshold, as we already showed, you have to pony up more cash to continue participating; otherwise, your positions are liquidated. So it provides a mark-to-market really provides a daily discipline of profit and loss that eliminates any carry forwards that might endanger traders, brokers, and the Clearinghouse. And this is how the Exchange provides this financial safety. It’s a financial safeguard for the Exchange. So, at the final end of the day, you know exactly what the position is, and then you can debit and credit at that level. And the Exchange provides a great service to all market participants as a result. It includes information about the underlying products as well.
If the Futures Contract is this, then there are assumptions about what the underlying security’s value is as well baked into that. And you can reverse engineer and get a better understanding of what the market is actually doing, thanks to the Futures market. So we talk about P&L now a little bit because this is important. And the first point I want to make out is that there’s the units for measuring performance in Futures contracts, and that’s the point value, also known as the multiplier or the contract size. And you need to know the point value well.
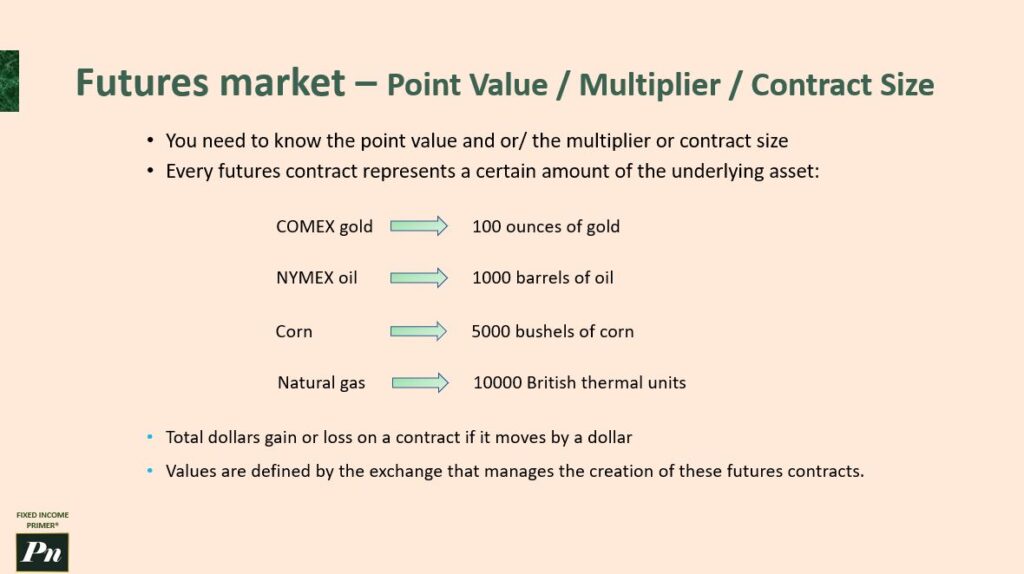
Point values
And every Futures contract represents a certain amount of that underlying asset, as we’ve discussed before. So, for example, the COMEX gold is 100 ounces of gold, troy ounces of gold. The NYMEX oil is a thousand barrels of oil. That’s pretty standard for oil. Corn, 5000 bushels of corn. Natural gas, 10,000 British thermal units. What’s good is you don’t actually need to necessarily understand the underlying unit measurement. You just have to understand the point value or contract size multiplier concept pretty well. Total dollar’s gains or losses on a contract if it moves by one dollar is important to understand. So values are defined by the Exchange that manages the creation of these Futures contracts in the first place. And so, you have to play the game as it’s presented. And right now, I want to focus on again the P&L concept. People talk about, “Oh, your P&L is impacted.” The dealers and the asset managers and even retail investors all have to look at the profit and loss.
What that really is the financial, from the financial statements perspective, it’s really the income statement. So it’s the most comprehensive view of a company or your own income and expenses over a period of time. It shows the net income and the loss for the period, as well as revenue, cost of goods sold, expenses, and other incomes and expenses. This information helps a company evaluate their performance and make decisions about how to manage their finances going forward. So, at the P&L calculation level, let’s take an example here. We’ve got the December 2024 crude oil calculation. Let’s say the decision is to buy one contract at fifty dollars. A thousand is the point value. What’s the sell if the price goes up by one dollar?
Now, remember, this fifty-one represents the price at the end of that trading day, the 4 pm Futures price. So pause the video, maybe do this out in pencil. I do have it in Excel, but I’m not going to bother showing you in Excel how to do this. It’s fairly clear that in this case, if the point value is a thousand and the price has gone up by one dollar, then your P&L should show a gain of one thousand. So P&L equals the change in price times the point value times the number of contracts. We’ve got one contract, we’ve got a point value of a thousand, and we’ve got the change being fifty-one minus one.
So unrealized profit and losses are absolutely real in the transaction. Let’s say you have bought five contracts of whatever the point value is 100. I think this would be gold. Let’s say the price is 1251.5 USD and then the price goes down to 1249 at the end of the day, and the P&L impact is going to be minus 125,000, right? Because you sold and so we have to make sure you get the order right here. This is negative because this was the original value and then your new value, right? The delta is negative. You times it by the point value and then by the number of contracts that you have in questions, so it’s 1250. Let’s try another one. So this is the S&P 500 E-mini.
Let’s say it’s the June 2025. Valuing assets and liabilities at the close of each day, the last known price is what we’re talking about here, this mark-to-market concept. So we’ve got day one, the number of contracts is one, price is 2700, and the point value is five, and we decide to hold. And on day two, the price goes down, so your P&L because you’re in your seller position, your P&L is 500. So in this case again, the change in price times the point value times the number of contracts generates this 500 total. It’s day two, we had that 500 growth that you got the gain that you had. So let’s say on day two, the number of contracts remains the same, and the value goes up to 2750 at the end of the day.
So remember, you’re in a sell position, and the value of the commodity has gone up. If you’re shorting a futures contract, remember, and the price goes up, you’re losing money in that case. So how do you calculate that? You get 3,000. So the math is the delta in price times the point value of 50 times the number of contracts, remembering that we’re doing the, um, you’re in a sell position. So you do your 2690 minus the new price to get your negative. Check logically in your head if it makes sense. If you are the seller and you’re shorting something, then, and the price goes up, then you should know that your P&L is going to be negatively impacted. Inversely, if you are in the short position and the price goes down, then your P&L is going to be positively impacted by that change.
So understand the underlying logic, and you don’t have to worry about where you position this number and this number in your calculation. And remember, the hypothetical 3,000 dollars is deducted from the trader’s account at the end of the second day, impacting margin. But this isn’t necessarily the end of the contract, right? So it’s only realized at the end of the contract or you cancel your position and you’re removing yourself from the position. So the point is this: futures mark-to-market mitigates risk. It’s all about quantifying the risk in real time and understanding what’s going on in the futures contract over time and what your position is, and it’s marked to market on a daily basis so that your manager, the asset manager company, if you’re in a bank, the dealer, they can actually evaluate your current performance on your positions that you’ve taken, and they can understand the overall position of the financial institution generally.
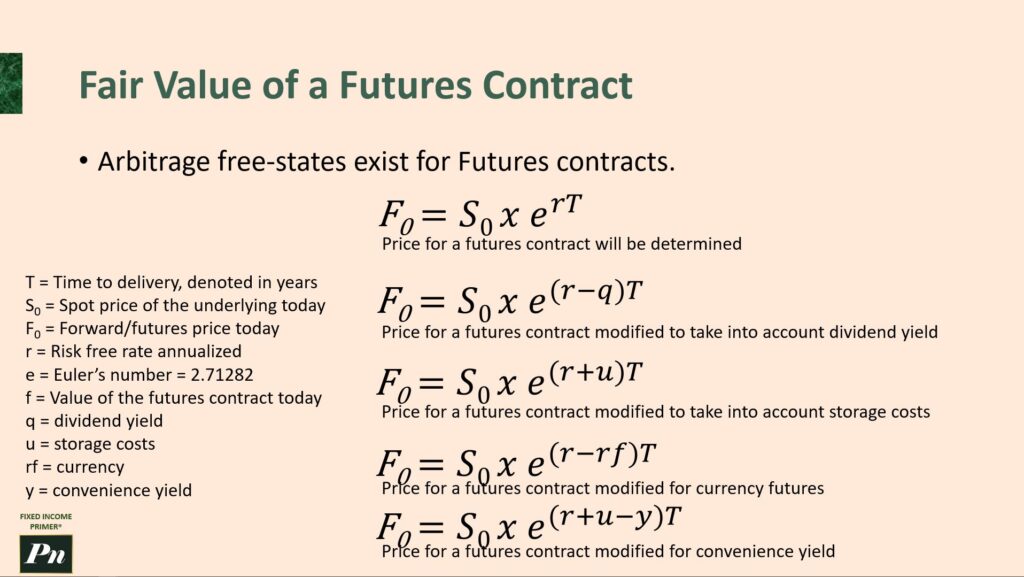
Fair value of a futures contract
So now let’s imagine we had to calculate the fair value of a futures contract when we had the bag of flour. We said 70 bucks as the fair value, and you get 70 bucks at the end of the contract, and then based on the agreement, someone’s a winner because the actual price may go up, and someone is unhappy. Someone’s happy here. The baker’s happy in the case where the price went down dramatically. The baker is unhappy because they have to pay 70 dollars for that bag of flour. Now, in reality, this seventy dollars is pegged against the spot price. Let’s say the spot price at the time was seventy dollars. Well, in futures contracts, there’s usually a difference because you have to take into account all these other factors like storing and all that. So it wouldn’t be 70 at the end. In reality, it might be something. If it’s contango, we’ll talk about that in a bit. If the price is upward sloping in terms of the futures curve, then it would go up.
Let’s say it’s 72 dollars. But if it was backwardation, then it would be going down. It’d be like 68. So let’s get into that. The first point I want to make is there’s a lot of arbitrage opportunities that can be realized in the futures price if the represented expected future value of the underlying discount is incorrect. Any deviation from the theoretical price, that is for this futures contract, the price that is agreed to, is a riskless profit opportunity and attracts buyers of the underpriced asset and sellers of the overpriced asset, right? You know, if your hypothesis is that it’s underpriced, then you would buy. If your hypothesis that it’s overpriced, then you would sell.
In other words, if you think the futures price is wrong, the fair value of the futures contract should be 68 for the bag of flour, not 70 or 72 for the bag of flour. Then you would want to take that into account in your calculations, and that drives the relationship between the prices back to an arbitrage-free state. In other words, it’s a hyper-efficient market because everyone is trying to realize an arbitrage opportunity, and as such, they drive the price back to an equilibrium or an arbitrage-free state.
I’m going to show you a classic formula. This is sort of very academic, so I’m a little hesitant to do this, but this is a classic formula for how to calculate a futures contract price. And so what do each of these icons represent? First, you’ve got time to delivery denoted in years. Then you’ve got your spot price of the underline today at Time Zero at trade inception. That’s that little figure. Then your forward futures price today. That’s actually what we’re trying to calculate. And then your risk-free rate annualized is the r, and you need to use Euler’s number. And he was a genius mathematician who basically is super critical for all of math at this point. And let’s go into Excel, and I’ll show you how this is done. So in Excel, we have this set up for the fair value calculations.
This is an Excel exercise, and I want you to basically complete fill these three cells up in the Excel. So take a crack at this, pause the video, go into the Excel, try it, and then unpause the video, and I’ll walk through it with you. Okay, so we’re in the Excel, and I’ve got the calculations in here. This is a forty dollar equity price on the spot. The date in our flowerback example, well, okay, so it would be seventy dollars, and you know the amount that you would receive at the end would be 70. But what we’re saying here is that the value of the futures contract today is 43 dollars. So there’s a three dollar contango, upward sloping futures curve for this calculation. Here we got our risk-free rate, that’s five percent, right? 0.05 is really it converts into five percent. And then we’ve got the time to delivery, so this is a three month contract, and the contract unit we have just one contract at play, but we want to make that dynamic so we’re and I’ll show you how. And so we’re also we’re really trying to find out what the forward futures price today that a short position would accept based on this available information. We’ve got the Euler number, which is static. That’s always the same number. It actually goes off into infinity, but for this precision, we just want five decimal places.
So what are we doing here? Well, we know that for sure you receive this number times the contract unit. How many contract units are there? Well, there’s just one contract unit. So what you’ll receive at the end of the three months in the long the futures position, you remember you’re buying this futures contract, someone’s taking the opposite position. They’re shorting this futures contract, and they have to deliver forty-three dollars at the end of the contract even though the price is 40 bucks presently. So in their rationale, it’s going to dip down by a significant amount in order for this to be an appealing contract. Now what is the forward futures price? So when we think about this, what are we really asking? This is the amount you’re committing to enter into the long position. And so we take the spot rate, we’re basically taking Excel and converting this formula into a nice smooth calculation. So we’re multiplying that by cell C23, which is the Euler number, and then we’re going to raise it. Right? Raising to the exponent R. So we’re going to have to do a bracket here. We’re going to do, um, probably have to do two brackets, actually, because we got to enclose the risk-free rate, close that, but then multiply it by time. Now time is a little tricky here because it’s always annualized. Very frequently, you’ll see that it’s annualized. So in this case, it is for sure. We’re going to do the C19, which is our three-month period, but we have to then annualize it. So that means dividing it by 12 to get 3 divided by 12 gives you 25 of the year or a quarter of the year or three months. And then we close that bracket. And then critically, to make this dynamic, so I can show you something cool, we want to make the contract unit included in the calculation.
I know it’s not in this formula here, but in order to illustrate the benefits of taking multiple contracts out at once, you get this multiplier benefit, and I’ll show you that in a sec. So what that ends up calculating out to is forty dollars and fifty cents. So in other words, this is the amount that you’re committing to the futures price today in order to participate in this contract. Now what’s the earnings then? So earnings is very basic. We’re going to say you receive 43 dollars from the short position folder, and you’re going to commit forty dollars and fifty cents today. So your benefit, your earnings, is two dollars and fifty cents in this case. Now let’s say, um, in this case, it’s such a nice opportunity, well, I probably want to really ratchet this up. And so suddenly when you increase the number of contracts, you really vastly increase the amount of earnings. So now it’s twenty-five thousand dollars roughly. If I add a couple extra zeros, we’re talking in the millions. Sorry, that’s too large for the. Just got to pop this out to show you what that, anyway, the point is money. You make it, you make a lot of money here. You know, 2.5 million.
Now, I want to actually make it a little more, um, realistic to again what this whole project is about is bonds. So let’s say the spot price is actually par, which is 100. And then we do the receiving. Let’s say it’s a par 7.5. So then this is more realistic to our bond market calculations. This is going to be relevant later on. And you can see that you’re gaining an earnings on that an expected return of 6.25 per bond that you have. Remember, bonds are calculated at the par, you know, typically a bond is denominated in a thousand dollars, but the, uh, the way we visualize it often is par is 100. And so we’ll talk about this a bit further along in the training course. So back to this slide, we’re just talking now about, okay, so this is a simplistic calculation.
Let’s get into the more detailed concepts around what I think we talked about earlier. In our earlier example, we had Trader A, Trader B, it was the carrying cost minus the convenience yield concept, which was a catch-all term for all the stuff around inflation, the risk-free rate of return, right? That’s in the formula cost and income received from holding the asset. Right? Storage costs, dividend costs. And remember, so the forward’s price is usually less than the spot price for beneficial assets, maybe like the financials like bonds and equity, although in my example above, I didn’t do that. I did the opposite. The forward rates are greater spot rates for burdensome, costly-to-hold assets like livestock, for example. That’s all in theory, right? In practice, in the real market, there’s all kinds of anomalies and behaviors that contravene this. But in essence, the cost of carry minus the convenience yield is what we’re going to talk about next. And there’s a couple formulas to understand. There’s the price for futures contract modified by the dividend yield for a given stock, right?
In the stock market, certain companies provide reliable dividends. It makes their company more attractive. They’re sort of their value plays, value stocks rather than growth stocks, which are, you know, don’t issue dividends but grow really fast relatively. Then there’s the concept as well as storage. So this is how you would calculate the storage costs. So you’re adding to the risk rate this storage cost calculation. And then also another one would be the actual currency futures factor, so relevant inflation factors.
And so this is negative in this case against the risk-free rate. And I’ll show you just quickly in Excel how this kind of works generally, but first I want to show the most important formula would probably have to be this convenience yield calculation, which as you can see, Euler’s number to the exponent of the risk-free rate annualized the storage cost minus the yield convenience yield times the time to deliver denoted in years gives us a good view of a convenience yield calculation. And I’m going to show in the spreadsheet in Excel a little more about this.
So, back to the Excel. We had the forty three dollars. We’re going to continue with that theme. I’m going to add some extra decimals here so we can see the same concept going forward.
I’m applying different formulas here below, so just for a quick view, dividend calculation. Here, the earnings are relative to this greater, so you get a financial benefit from entering into this contract that is that gives you more earnings, rather. And then look at the storage calculation.
So, here we’re taking the formula for the storage calculation and putting it into this format, and you can see that actually your earnings are diminished somewhat again because you’re taking the long position. Storage costs are calculated into it. You don’t get as much in today’s price for participating in this because of you have to pay a little more to enter into this contract because of the storage costs, and then the convenience yield.
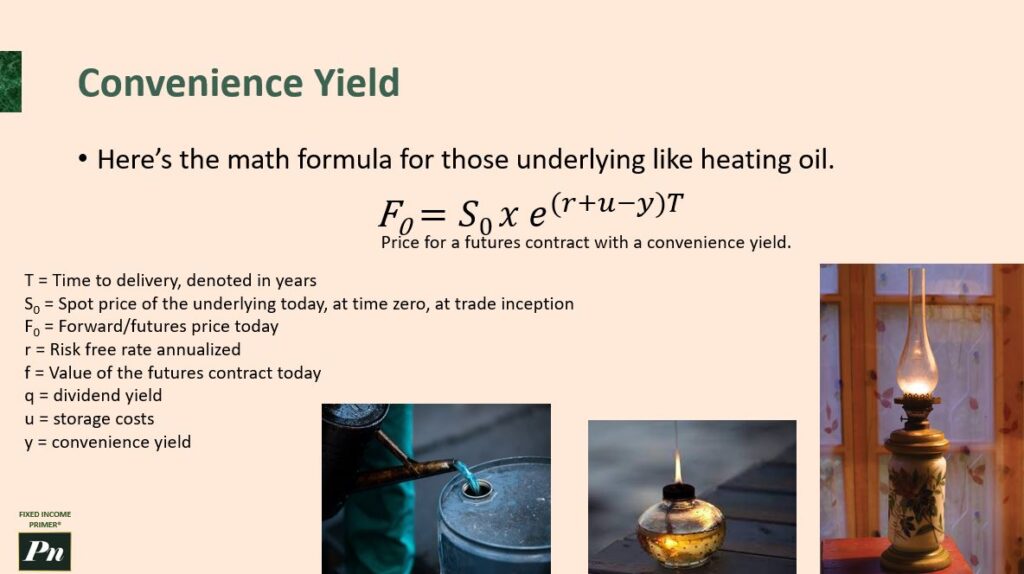
Convenience yield
So, convenience yield is really important to understand. So, this is the formula for convenience yield. I haven’t built this, I don’t think correctly, have I? So, we’re taking in 30, which is the 40 box, 36, which is the older number, yep, and then C31 is again the risk-free rate, plus right, plus the storage cost, so storage cost is there, and then minus this convenience yield. Now, this is all made-up numbers, plugged-in numbers, and then times that by T. So, the point here, though, is that basically if we have F already, if we calculate this number, this is the number we’re provided, then we should be able to isolate the convenience yield. So often, convenience yield isn’t explicitly provided, it’s implied by what the cost of entering into the contract is. So, keep that in mind, and I’ll show you a little more about this.
So again, this is the formula for convenience yield calculation, and I want to hone in on this example of heating oil and why it’s kind of interesting here. It’s a classic example of what the convenience yield is. In winter months, there’s actually a benefit of not holding the Futures Contract but rather holding an inventory. This heating oil, obviously, there’s a cost to storage, but there’s this convenience benefit of having the heating oil in your possession, especially if it’s cold and you need it to heat your home or run your business. So, this benefit is really known as the convenience yield. Everyone who owns inventory has a choice between consumption today versus investment for the future. So, the rational investor will choose the outcome that’s best for them in the circumstances, whether they would actually use the thing that they have in the Futures Contract. They’re the one holding the asset, and they’ll deliver it at the end of the contract to the person taking the long position.
They can actually consume it and maybe replace and find more sources. But it’s important to understand that the convenience yield is that benefit to the person taking the short position who has the inventory in their possession. So yeah, we have the formulas here, we have the basic breakdowns. The key is important to understand that the Y is not easily provided. Textbooks won’t really easily provide and in real life, they’re not easily provided. You have to actually back out of the yield, the convenience yield, based on the other variables that you have numbers for. So in most cases, you’ll have, of course, forward Futures price today, what that entry cost is, and what the spot price is. And Euler’s number is always the same number. And then you’ve got these other inputs you’ll be able to typically back out and reverse engineer your way to finding out what the convenience yield is. But it’s never, understand this, it’s never explicitly provided in the real Marketplace. It’s implied through what these numbers provide in the marketplace, if that makes sense, hopefully. And so, let’s continue on now.
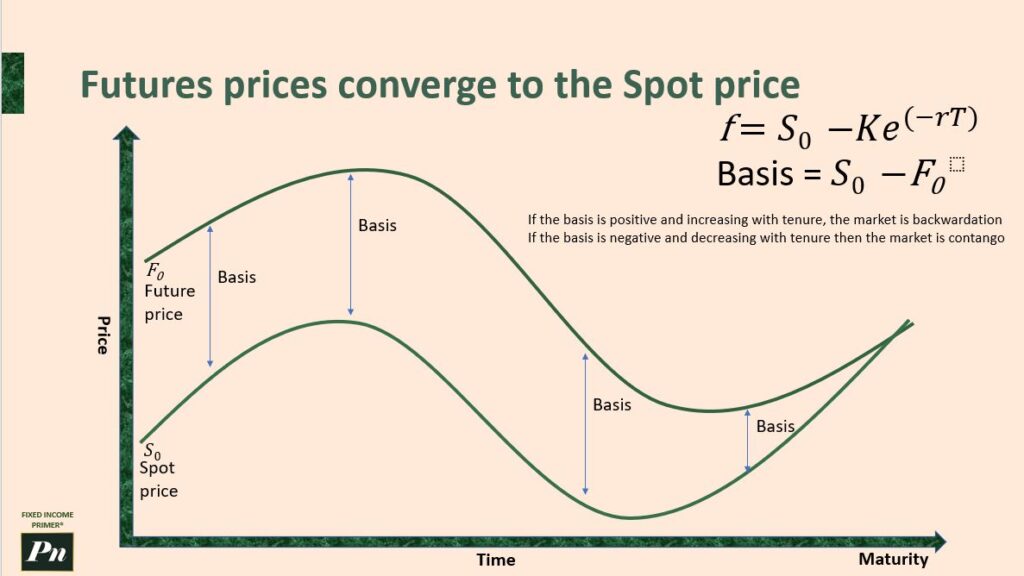
Futures prices converge towards the spot price
Let’s ratchet up the complexity a little more and talk about the Futures prices and how they converge to the spot price, the spot price being that now price whenever you are in the Continuum of time, basically. So, you’ve got your price on the left Y-axis and time and maturity on the X-axis. And what we’ll see here is your Futures prices, they are, in this case, above the spot price. And what happens is they converge at this point, at the point of maturity. They converge. And so, the one formula to know about is the value of the Futures Contract at Inception is zero. And it’s important to clarify here that we’re talking about value rather than price. But the value of a Futures Contract mid-stream through its life is calculated using this formula here. I’m not going to get into much detail at this point. I’ll touch on it later. But just as an FYI, and the key here is Basis, understanding Basis is going to be critical in Futures Trading.
So, Basis is actually the spot price at any point in time. Remember, spot, as I say, is the now price, right? At any point in the Continuum of time, it’s the spot price minus the Futures price at that similar point in time. So if the spot price is 10 and the Futures price is 15, then you’re going to have a negative number here as your basis, a negative basis. And if it’s a negative basis and decreasing with tenor, if it’s decreasing over time, then the market is, in fact, something called contango. And don’t worry, we’re going to get into more detail about it in a sec.
If the price, let’s say, of the spot price is 10 and this Futures line is actually all the way down here, then in this case, excuse the line going below the actual X-axis, but okay, in this case, the Futures price is eight, and the spot price is 10. Then it’s a positive basis. And if it’s a positive basis and increasing with tenor, the market is backwardation. So, we’re calculating this basis concept. That’s going to be key to understand in the future. And I think this is in Futures generally and in the future of this training program. But so this is one way to illustrate it, and I think it’s a useful one, and I want to make sure this is locked in because now we’re going to talk a little more about contango specifically.
So now we’re going to talk about the Futures curve, which is a snapshot of delivery dates, and in that context, we’ll then reference contango and we’ll get into detail about that as well. So, on the left, you’ve got prices, and then on the bottom, we have months for future delivery dates. And we’re going to use the example of oranges. If you’ve seen the movie Trading Places with Eddie Murphy and Dan Aykroyd, I highly recommend it. If you don’t see the whole movie, definitely watch on YouTube this the climactic scene where they engage in Orange Futures Trading. It’s very interesting, and it’s an ancient movie. You might say it’s from the 1980s, definitely before most of us were born, but anyway, it’s a great movie, and it provides some context.
So, what we’re talking about here, though, is the spot price of a pound of oranges. So everything’s measured in a given pound of oranges for this illustration. And we’ve got a spot price of 10 cents. Then we’ve got the settlement price that I can get on these Futures contracts. For a one-month future contract, I would pay 12 cents per pound. A two-month contract, 15 cents per pound. A three-month, maybe 16 and a half. A four-month, and then a five-month is 20 cents per pound. So what are you actually doing here? This is not saying that a month from now the market price is going to be 12 cents. No, no, no. The market price, the spot price, could be down here. It could just go over here. It could do that. It could be sort of shaping that way and sort of continuing that way. This is the Futures price, right?
And so, this, as you can see, is kind of a natural, normal upward-sloping curve. And this is what you would expect with commodities. If it wasn’t upward-sloping, I could sell now, and then I would push the price down correspondingly. And you shouldn’t really see downward-sloping Futures curves too often. But we will talk about that as well.
So, what’s happening here? This upward-sloping is the price of the assets in the future are higher than it is now. I can confirm that, right? It’s 10 cents, and it’s higher. This is known as contango. The further out you want the delivery, the further you’re going to be charged, the more you’re going to be charged. So typically, the price of an asset, the price is slightly above compared to the current now or spot price. So, I think it would help be helpful to imagine another context. What happens to the Futures curve? We know in the bond market, we talk about the yield curve, and when it moves, what happens?
When there’s an increased demand for oranges, let’s say, for example, that there’s a huge new government health subsidy that says you’ll get a tax rebate if you show the government receipts of how many oranges you bought per month or per year. Sounds kind of draconian and strange, but let’s just say that as the example, there’s a huge health subsidy, and you get taxed back. So suddenly, the demand for oranges is going to logically push up, including the spot price.
So, this Futures curve is going to suddenly push up too. If you want one month’s delivery with this new information entering the market about a government subsidy, now it’s almost 16 cents per pound, and then it goes up to almost 19 cents per pound. The whole curve moves up. And so, what we’re understanding is the whole curve moves up is naturally curved upward, and this is a contango circumstance.
And understand what’s really going on here. There’s this cost of carry concept in here, baked in here as well. And what we’re saying is, “I am prepared to sell you oranges in five months, but I’m going to be holding these oranges for this whole period, and the spot price is going to be probably down here during that whole period.” So, the Futures price is going to be higher than the spot price because I have to manage, take care of the oranges, spray them, all that inventory management. And I’m the short on this contract.
So, I should charge a little higher fee in benefit to myself because I’m taking on this additional risk. And so, this whole concept of contango, as well as backwardation, we’ll talk about too, arises, and it basically comes from an economist named John Maynard Keynes, who argued that, in general, the natural hedgers of a commodity are those who wish to sell the commodity in the future because they have it in their possession. They have to hedge that risk. Thus, hedgers are collectively holding a short position in the forward market. The other side of these contracts must then be speculators. They must, therefore, hold long positions, again. They want to get the oranges at a future date. And so, the hedgers are interested in reducing risk and thus will accept losing money on their forward contracts.
And so, he’s arguing, John Maynard Keynes, who’s pictured here, he’s arguing that speculators are holding a net long position, and it must be the case that the expected future spot rate, therefore, is going to be greater than the forward price. And it’s going to be greater than the spot price. Now, John Maynard Keynes has been very influential in economics and macroeconomics.
So, research him if you haven’t heard of him. Take a look at some of his other work. He’s quite fascinating, and he’s had a huge impact on how Western governments operate, even to this day, for better or worse. Now, it is typically in a contango environment the now price, the spot price, is cheaper, and the Futures price is more expensive. So, the spot market hits 10 cents per pound, and let’s say in a year’s time, and it’s 24 cents per pound. You could have ounces of gold, you know, 15 ounces of gold, and then 16 ounces of gold.
This is reasonable contango, what this might be referred to as. And so, there’s this opportunity cost, and the Futures contract, there’s the storage costs. And I guess the Futures contract makes sense as a result because you have these factors that are implied in the price. And contango reflects that, that Futures curve upward sloping contango reflects that. So, you might even see, for example, a surplus of oil and a shortage of oil. So, if there’s a surplus of oil at the start of the year, the spot price is 40 bucks a barrel. And then in a year’s time, though, there’s an expectation there will be a shortage of oil. So, that price is 140. This would be characterized as sort of more severe contango. It’s way more upward sloping. It would be more severe. And so, we’re anticipating in the Futures market some global catastrophe that would lead to this circumstance. But usually, it’s bearish because I would buy for 40 dollars a barrel and then sell for 140, pushing the curve downwards, as I mentioned already.
And I’ll mention here too again the basis. So, the basis was what we showed in the prior slide. It’s the gap between the future price and the spot price at any point along the time horizon of the contract. So, not the same thing as what this Futures curve shows, right? It’s a separate illustration we had as you, sorry, the Futures price up at the top and then the spot price. And if there’s another circumstance called backwardation, the Futures pressures are below and the spot price is in the middle. Don’t worry, we’re going to go through more examples.
So really quickly, here are the characteristics of contango. As we’ve discussed, the market in contango has future prices that are higher than the spot prices, and spot prices are the prices for taking delivery now. The upward sloping futures curve with longer data contracts carrying higher prices than shorter data contracts makes sense.
Now, yeah, the basis or the difference between the spot and the futures price is negative when it’s contango based on the way the formulas are formatted here, right? You’ve got your spot price minus future price. Then traders can take advantage of contango by buying near-term contracts and selling the long-term contracts, which are higher priced. Contango is usually seen in markets with abundant supply and strong demand presently, but uncertainty about the future.
Contango is caused by inflation expectation, future supply disruptions, and the carrying cost or cost of carry of the commodity. Sometimes I say convenience yield, that’s not what I mean. Convenience yield is a deduction, a benefit that the short position has. The cost of carry is the burden of having the short position because you’re holding the commodity. So other causes to talk about, definitely political instability, weather, crops. Weather is a big one, and that’s going to come up with our backwardation example. Also, don’t forget that sentiment traders and investors can change their minds about the market, and that is described in the contango shape of the futures curve, which again is a snapshot of delivery dates.
So picking up where we left off, we’re still talking about the futures curve, and we’re talking about, again, a snapshot of deliveries. But now let’s discuss backwardation. So it’s the same orange example, but note that the spot price is 30 cents, but then down into the future, it goes all the way to 16 cents per pound. So why would this be happening, and what’s going on here? Well, let’s say there’s a sudden crop failure in Florida. The orange groves are all frozen over, for example. So that might be one causal variable that would describe this situation.
Suddenly, crops are failing, and so there’s a real panic and a need for more supply, and there’s an expectation that there will be difficulty in getting new supply because a huge crop has just failed. And that’s, in fact, what happens in the film Trading Places, where they find out from a weather report it changes the futures curve dramatically. So right now, it’s quite expensive in this circumstance for oranges because the current price is 30 cents per pound. And that’s because the demand is way higher than the current supply. So people who do have an axe to grind, i.e., they have oranges in their inventory, will likely want to spot sell this right now and start delivering it. And that’ll start to push the price down.
So we’ve got your spot price again for delivery today, pay today, is 30 cents per pound. But five months later, it’s lower at 16 cents per pound. The futures contract, agreeing today to pay 16 cents per pound in five months’ time. And so this is an example of where we’re desperate now. There’s a shortage or crop that’s destroyed, and it’s not necessarily a good situation. The price is not going up across the curve into the future. The futures curve, in fact, is going to probably go downwards. And so this is generally speaking a hard-to-tell market whether it’s a good thing or not. But if the futures prices are less than that of the current spot price, then we know we’re in backwardation. And it’s quite rare, to be honest. So if you have oranges now, you sell them now, and then you would buy them back. You would sell them at 30 cents, and then you would buy a futures contract to get them back at 21 cents, and you would get the difference. And there’s an arbitrage opportunity here.
Then we’ll talk a bit more about that as well. But the futures, knowing the delivery prices are going to be lower than the cash you collect now, is what motivates selling in the spot circumstance and basically shorting now and then pocketing the difference in the future. And again, basis is the gap between what the spot price is now and the five months or wherever the futures contract delivery date is. And so here, it’s going to definitely be positive because, well, it’s going to be positive because the spot price minus the futures price is going to be positive in this case.
The characteristics of backwardation: the market is backwardation and characterized if the futures prices are lower than the spot price. There’s a downward sloping futures curve with short-dated contracts carrying higher prices than the longer-dated contracts. The basis or the difference between the spot and the futures price is positive, right? Because the spot was 30 and then the future was 16, so you would have a positive integer here because 30 minus 16 is a positive number. The traders may take advantage of backwardation by selling near-term contracts and buying long-term contracts. They may sell the spot, in fact, and then buy the long. Backwardation is often seen in markets where there is limited supply and weaker demand as well.
Now, just a further example of contango and using the orange analogy again. Let’s go back to this example we had, and we had the futures curve. Remember, this was the spot price, and then this was the price today in the market if you were to agree to buy oranges in one month’s time, two months’ time, five months’ time. And thus, this is a snapshot of futures prices here, and this is the spot price. And let’s say that suddenly oranges became hyper-popular for whatever reason. The whole curve would move up, including the spot price. And then the one-month futures contract would go up as well, correspondingly.
So you wouldn’t get a better deal typically in a contango environment. And so it’s really important to understand that this futures curve is not the spot price. This isn’t the spot price in two months. Just make sure you really like that. That’s not what this is. That’s not the spot price predicted that it’s going to go up five cents as the spot price. So I really want to show the price movements over time, and that’s what this chart will show. So here is the spot price over time. It goes from 10 cents, and maybe there are some issues, and it migrates up to maybe 12 or 11 cents over time, the actual spot price. And now we want to look at how does this interact with these futures prices.
So in the futures prices, you might have that two-month contract. It’s 15 cents per pound, and at initiation of the contract, it’s worth 15 cents per pound, but it migrates down to what price? It always migrates to the expiry date price, the maturity price, and that’s the spot price of roughly 10 cents here. Same thing with the five-month agreement, which was 20 cents per pound. So that migrates down over time as time proceeds, as you get closer to the maturity date. This line should probably be a little closer to here, but that’s all good. Basically, at the end of the fifth month, when you hit the fifth month, it will be the spot price. It will be the equivalent value. And this was that concept from earlier where it converges at maturity. And so that’s what’s really happening here.
So when people say things are in contango, the market is in contango, they’re usually saying the whole curve is upward sloping. So keep that in mind. And more correctly, referring to markets in contango is actually this movement downwards over time from the futures price to the maturity point. That is technically when you mean market is in contango. It’s moving downward, the price difference, the basis over time between the initiation of a contract and the contract’s expiry, it moves downwards. And this will be important later on. That’s why I’m bringing it up now.
So a further academic element to this is the expected price theory, which states in contango circumstances, there should be a significant price gap between the spot price and the futures price, the five-month price in particular. There’s a significant expected price gap. There’s an expected price theory, but there’s no way to know exactly what this should be because it’s a marketplace. And so the futures curve is dictated by what participants are willing to pay, what the cost of carry and the yield, convenience yield, is. For example, all these different factors will impact what this curve looks like.
Same concept with futures curves with backwardation. We have this example from earlier, the 31 cents per pound, and look at it diving down to 16 cents, and then the price movements over time. Let’s illustrate that. So you’ve got your spot price, and it’s relatively stable over time. So each one of these contracts, the 27 cents per pound, the 21 cents, they all migrate based on how far away they are from duration to this spot price at the top. So everything migrates closer to it. And these aren’t just stable lines. These are market lines.
So you could enter and exit a different futures contract, getting closer, closer, closer, closer. You could probably enter into it at any time here too, but you know it’d be so close to the spot price, why would you? But over here, you have a potential strategy around taking advantage of the situation. So this is all to say that the futures prices migrate towards the expiry and in bonds, it’s actually very similar. If there’s a discounted bond, it migrates towards maturity and hits par. If it’s a premium bond, the price migrates down to par as well. It’s kind of a beautiful system to describe what would efficiently make sense. You want to pay a spot price at the point of maturity.
So just like contango, backwardation, the expected price theory, normal backwardation would show that there is a significant discount to futures prices in the circumstance. We don’t know what that discount should be at the time, but it will be a significant discount. And then sometimes it’s referred to market as in backwardation when it’s downward sloping like this. But more accurately, what we’re really saying is the market is in backwardation where the prices are migrating upwards towards the spot price over time as they get closer to maturity.
I want to talk now about hedgers versus speculators. Hedgers basically buy or sell the physical commodity. They can be farmers, they can be manufacturers, they can be jet airline financial planners, the CFOs, Chief Financial Officers of an airline. There are risks that they’re concerned about. There’s the exchange rate risk, right? The actual currency’s value. There’s an interest rate risk, which is the cost of borrowing. And then there are the actual commodity prices that they’re concerned about. Speculators, on the other hand, do not have any skin in the game directly with the commodity in question. They’re playing the market, and they’re taking market risk for profit. And they’re providing price discovery inputs into the market as what they think helps distill the value of the thing that they are pricing at that very moment in time. And it’s a complex system that’s distilled into single price points.
The hedgers use futures contracts to manage and offset risk, to really hone in on this a bit further and use an example from a farmer’s perspective. So we have this farmer on the top right, a lovely lady who wants to offset a risk. She believes that the price of her wheat commodity, the wheat that she’s selling in the market, is going to actually fall down by the fall. So in the spring, she’s thinking the price is going to go down, and she wants to offset this risk. And so in the fall, as you can see, the price has dropped. So she would be down in terms of cash if she had to sell her wheat in the market at the end of the season.
So by taking a futures contract, she’s offsetting that risk, not perfectly, but very well. And then the opposite position might have been taken. So the inverse case, the price of wheat is lower, and the price at the end of the year is higher, and this farmer can offset and establish a price level well before the fall. So her skin doesn’t have to actually worry about this concern around what the price will actually be. So what kind of a hedger is this farmer? Well, long hedgers are concerned about rising commodity prices and are thus long the futures. Then the short hedgers are concerned about the falling prices and are short hedgers. So you get the cash offset for the wheat in either case. And so it’s very much a cash-based transaction, and there’s that novation process we talked about before.
The other groups of people who are involved in this are really these manufacturers, for example, technically called merchandisers, and they see the risk of a spread between the purchase and selling price of their product. We had the cereal example long ago now, where we were showing that the price of cereal, the consumer wants a stable price, but the manufacturer and the merchandiser, quote-unquote, is concerned about the fact that the price for corn fluctuates wildly while corn flakes are flat over the year. So profitability of a car manufacturer, let’s take that example now, it depends on the input cost of steel, aluminum, battery components, all of these pieces of the puzzle that get put into a car to create the final product, and their price fluctuations are happening just as well as the wheat farmers’ price fluctuations. So they’re also engaged in these cash and futures transaction setups to offset the risk. And it gets really interesting, too. Steel manufacturers, the price of steel will fluctuate, and demand for steel will change. And we’ll also show here the airline’s hedge jet fuel prices. I’m really excited to talk further about that particular example.
So we open up this section with a question: Why is Southwest Airlines so successful? And a lot of people have different hypotheses. There are no frills airlines, which means you don’t get a lot of fancy additional benefits the way that other major carriers in the US operate. High levels of customer satisfaction, there’s you know, you can cancel your reservation. Employee satisfaction is really good. There’s never been a very significant strike and there are 75,000 employees.
You can look at the history of how it started in the state of Texas in Dallas, Houston, San Antonio. They had at least three 747s. They were very edgy, and they had a love theme and their stock ticker is LUV. They had peanuts that you could have on the plane. Anyone with a peanut allergy would probably not like it, but most people don’t have peanut allergies. 13 planes. They now have 700 planes, so that makes them really good. They got same mechanics, same planes applied across their entire fleet. They do point to point. There’s no hubs. You don’t have to go through a hub city. Basically, they’re low prices, low fares really push the price down. So they have a fun image. All these different theories as to why is this airline so successful. Well, get prepared for the truth of the situation. One of the biggest causal factors, there’s no single one cause, but the thing that a lot of analysts tend to overlook is this: Southwest Airlines was an amazing hedger of jet fuel, and they did that through futures contracts. And it all starts with a guy named Kelly Gary Kelly, who joined Southwest in 1986, becomes the Chief Financial Officer and noted that the late 1970s strategy of jet fuel futures really makes a lot of sense. Post-Gulf War in 1991, Southwest dedicated 100% of its jet fuel needs in 2000 alone to futures contracts. They were so deeply hedged in this way that if they did something wrong, it would probably have unraveled quite badly, but they did it really well.
From 1998 to the summer of 2008, Southwest saved an estimated $3.5 billion versus the average jet fuel price paid around the industry. 83% of Southwest’s profits in that decade were from hedging mastery. And so Southwest Airlines invested in these oil futures by entering into these long positions, long fuel hedging contracts with a variety of oil producers. These contracts allowed Southwest to buy crude oil at a fixed price over a specified period of time, thus avoiding the volatility of the actual market. And the contracts also allowed Southwest to efficiently manage their fuel costs, protecting them from sudden increases in those fuel costs. Now, don’t get me wrong, I think other airlines definitely do this, but Southwest did it particularly well based on this performance. So we talk about barrels of oil as a really powerful futures contract. In fact, the Brent crude oil is very strongly correlative to the jet fuel futures contract, which I’ll talk about in a sec. The point, though, is that when you buy oil, the overall price of oil is impacted by these different sub-components and the demand for those sub-components. Jet fuel being a sub-component of a barrel of oil, about 8% of any barrel of oil is going to be refined into jet fuel. And just as a side note, I think this is just more interesting than anything. Chemistry-wise, this is what a gasoline compound looks like over here, and I’ll link to the description at the bottom where I got this screenshot from. But this basically shows that you take your crude oil and you can convert it and you heat it up and based on the molecular structure, the different types of oil are separated out in this chamber. This is called fractional distillation of crude oil process. So one of the elements is basically kerosene, and you can get into more nuance. There’s lots of great YouTube videos on jet fuel and the future of jet fuel. I highly recommend there’s one Google that one.
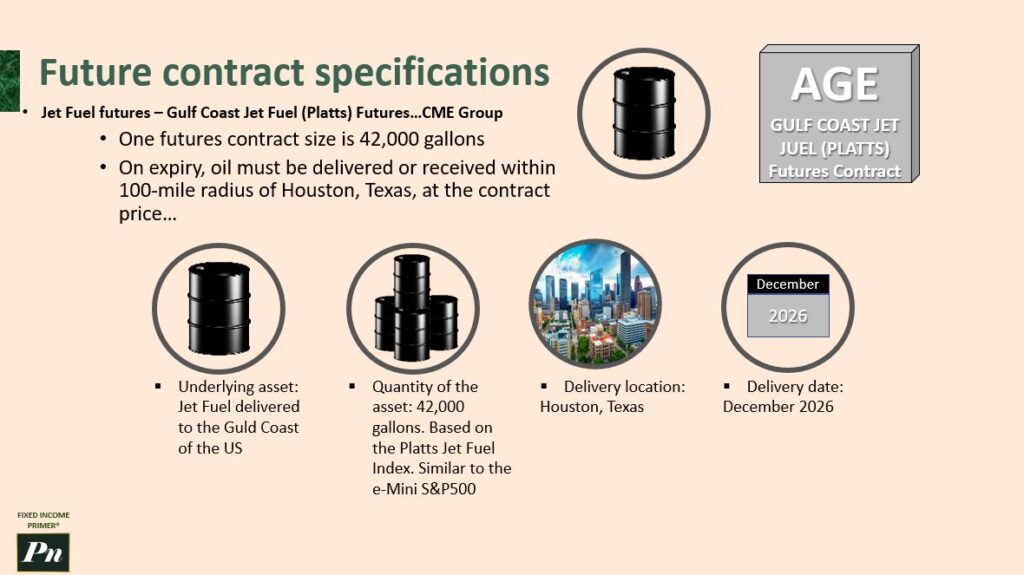
Future contract specifications
But the point is, what we’re going to talk about now is jet fuel a little bit more. There’s the futures contract specifications. We haven’t really touched too much on the details of it, but there’s a jet fuel futures called the Gulf Coast jet fuel Platts futures, and it’s on the CME, the Chicago Mercantile Exchange, the Chicago Board of Trade, and CME combined. So now they’re all under the CME Group in Chicago. And so one futures contract is 42,000 gallons, and on expiry, you have to deliver this oil within a 100-mile radius of Houston, Texas at the contract price. Unless you trade for cash, you settle in cash. And so you’re buying and selling these jet fuel futures contracts. You need to understand the representative reporting of these contracts, all this detailed stuff, how it’s the nomenclature, it’s the age. And so you have the underlying jet fuel, you have it in a huge portion. It gets delivered to Houston, Texas. It has a specific futures delivery date, all of this nuance. I’m not going to show in what we’re going to do next, which is an Excel spreadsheet.
So a great way to learn is to do things in Excel. And so the associated Excel spreadsheet has an example here of the Southwest Jet Fuel example, and I’ll just point out, though, we’re actually talking about Brent crude oil, which is a strong proxy for the jet fuel futures. They’re two different commodities, but the Brent crude oil is, you know, it’s a type of sweet crude oil while jet fuel is really referring to aviation turbine fuel, kerosene. There’s the US and then global versions, which freeze at different temperatures. Blah, blah, blah. This is just an example. Let’s go through this process. I’m going to ask you to calculate out a couple things. So you need to calculate the change per barrel daily PL. Now, if you remember, the PL was all about at the end of the day closing prices and then the total barrel daily PL. You’re going to need to also calculate the cumulative total per barrel total, and then the current account adjusting the margin payments before and after. These are all the different subset tasks in the Excel. And so the blue fields are the ones that you need to populate. So I’m going to let you dive in there, see what you can do with it, and then unpause the video, and I will go through it with you. So here we are.
We’ve got this Brent crude example. This airline is going to take a hedging position by going long because they believe the price is going to go up in the real market. And they’re going to enter into this contract in July, and then they’re going to need the actual underlying in September, end of September. And so this is the contract. I’ll call out NEDL, and I’ll link to the description there, the channel that helped build this model. This is largely based on their model. So I want to draw your attention first to the contract size in barrels as specified by the exchange, and then the value per point, which is also an important metric, or value per unit, which is another important metric to understand as well. So looking down here, we’ve got our dates into the future, and we’ve got our spot price. What is the spot price? It’s the current market price throughout this period. So all this data below indicates the actual prices, the spot market at the time.
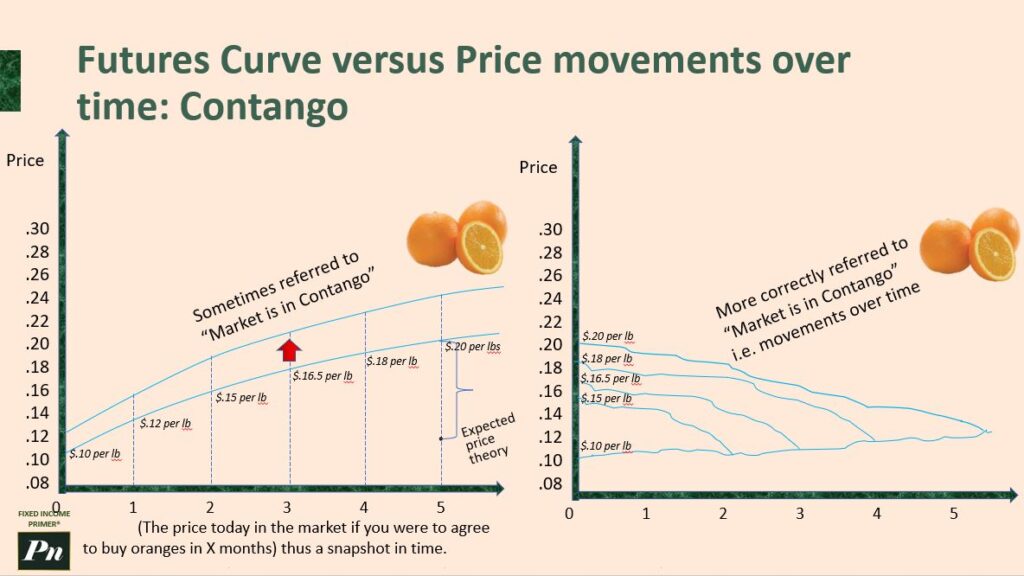
Futures curves and contango
So we’re looking backwards in time. This is all historical data. This contract’s already been conducted. This contract is now finished, and we’re looking at it now, historical. So as you can see, it’s measured in USD per barrel. USD is the global reserve currency, so a lot of oil is determined in USD currency, even to this day and likely ongoing. Although there’s some debate about dedolarization. And a barrel is just, remember, it’s a measure of the volume of oil. It’s a container, basically. And then we have the futures price. And this is measured units per contract. So as you know, the contracts per barrel is static. Usually, the exchange sets it at a thousand, for example. And so this is a in the market price. And as you can see, it’s contango. It’s upward sloping. It’s higher than the spot price. So the first calculation you should do is the futures USD per barrel. Now, this contract is fairly simple because you’re sending the per unit contract to the futures contract. Then you have to multiply that by the value per point, and then we will set that static. And then divide by, oops, static. And then divide by the contract size in barrels. And this will get us, in this case, this exact amount here. This is trivial in this case, but in other contracts, it could be more complex.
I’m going to double click here, and it’ll go all the way down to the bottom. And you’ll note that all the fields appear the same across these. So now I also want to draw your attention to this. This is the end of September futures contract, and this is important. It’s the very last trading day of that month in 2023. That is the maturity date, and that fits the conventions on the exchange. We’ll even talk about that. Obviously, with bonds, it’ll be the same story. You have a window in which you can deliver the asset. So and typically, in this oil futures context, it is, in fact, at the end of the month that the contract expires. So with these commodities, you have to have one specified day of the month for the expiry. As I was just mentioning, bonds, you can have it across an entire month. But for what we’re doing right now, oil futures, you have a specific date in the month so that there’s not too much fragmentation. Everyone is landing on the same date for this very specific commodity. So this airline is taking a long position. They want specifically the number of barrels they want is 10,000. And so in the manufacturing or in the airline or the industry itself, in this case, they do want the physical oil, let’s say maybe. But they don’t actually have to take it. Again, they have a long position. They can actually settle in the financial sense, in the financial risks and cover their exposure to the change in price, as we’ve discussed before.
So while this is an airline, and yeah, sure, airlines need oil, they need specifically jet fuel, they don’t necessarily have to take the underlying at the end of the contract, as we’ve discussed before. In other words, they can settle in cash. In other words, they can settle in cash.
So again, they’re financially hedging their risk of this ever-changing price in actual oil forwards contracts. However, you might have a specific relationship with jet fuel manufacturers, oil producers at the Gulf Coast, etc., to actually get your true supply that supports your airline. Those are separate streams of effort. This is the specific financial stream of effort that we’re focused on. And of course, with futures, with forwards contracts, you can negotiate the specific date and time. It can be very flexible because it’s a contractual obligation that is not a tradable asset on an exchange. It’s not standardized. So now let’s answer the question on positions. Well, how many contracts do we actually need in this case? So I would go here and I would select, okay, we’ve got 10,000, and we want to calculate this out. It’s 10, the denominator is our actual contract size in barrels, and the position in barrels is our numerator. And that gets us, obviously, you can just see it’s 10 contracts for $10,000 of capital. You need 10 contract sizes to fulfill your obligation, to fulfill your request. So the contract value, in this case, we can calculate this by going simply taking our futures price at the start of the contract, again, the Monday.
So technically, I should change this to this number. So on Monday, July 31st, so we go contract value equals this number times our contract position, and I’ll get us our answer of $392,500. The other way we could do this also, though, is to go instead, we would take the unit per contract, times it by the number of contracts we have, and then times it by our point value. And that would get us the same answer. But let’s go with this one here to get our calculation. So now we’ll talk about initial margin. We’re now familiar with that and the margin call threshold. We’ve had, I’ve demonstrated what those were before. These are basically how the exchange makes sure this is a safe place to conduct these transactions and also avoids intentional default. “I’d like to get out of this contract, so I’m just going to walk away from the exchange and wipe my hands at this contract because I don’t like the way the contract is going. It’s not advantageous to me.” No, the exchange makes you cross their palms with capital, cross their palms with silver, is the proper expression, and say, “Okay, yeah, actually, I need to continue this contract, and I’m financially obligated to do so. I can’t just simply say, ‘Oh, I entered into this deal, and now I want to walk away.’ They’re financially obligated to participate through to the end because they have to put this capital down.
It protects the exchange, who is the one taking the actual risk because, remember, two counterparties, they don’t need to know each other at all in the futures market. And so this is a mechanism to protect them. So as I mentioned before, you can actually expect the exchange to change the initial margin percentage.
It can vary depending on the contract, depending on the circumstances. They can make these modifications. But here, as we can see, the initial margin I have to cross their palms with is $60,000. And we have this. And so our current contract value that we’re putting into this, so our initial margin as a percentage of the capital we have at stake is 15.29%. So I want to draw your attention to the process of how the price over time starts to narrow by the very end as you get very close to the settlement date. The futures price and the corresponding spot price really narrow and get back close together.
So we’ve talked about that before in the prior sections. So this shouldn’t be a surprise. This makes sense because now you know the period in which you are really making a gamble on the decision of what the price should be should be narrowing quite fast. So now, again, we’re in a long position. So in our circumstance, what do we want to have happen? Well, ideally, we want the actual spot price to go higher over time so that at the end of the contract, we get the oil at the price that we agreed to, the futures price, which is lower than the market price. If the market price goes up to, oh, so good, yeah, $45. It went from $37. Our futures price was $39.
So we open up this section with a question: Why is Southwest Airlines so successful? And a lot of people have different hypotheses. There are no frills airlines, which means you don’t get a lot of fancy additional benefits the way that other major carriers in the US operate. High levels of customer satisfaction, there’s you know, you can cancel your reservation. Employee satisfaction is really good. There’s never been a very significant strike and there are 75,000 employees. You can look at the history of how it started in the state of Texas in Dallas, Houston, San Antonio. They had at least three 747s. They were very edgy, and they had a love theme and their stock ticker is LUV. They had peanuts that you could have on the plane. Anyone with a peanut allergy would probably not like it, but most people don’t have peanut allergies. 13 planes. They now have 700 planes, so that makes them really good. They got same mechanics, same planes applied across their entire fleet. They do point to point. There’s no hubs. You don’t have to go through a hub city. Basically, they’re low prices, low fares really push the price down. So they have a fun image.
All these different theories as to why is this airline so successful. Well, get prepared for the truth of the situation. One of the biggest causal factors, there’s no single one cause, but the thing that a lot of analysts tend to overlook is this: Southwest Airlines was an amazing hedger of jet fuel, and they did that through futures contracts. And it all starts with a guy named Kelly Gary Kelly, who joined Southwest in 1986, becomes the Chief Financial Officer and noted that the late 1970s strategy of jet fuel futures really makes a lot of sense. Post-Gulf War in 1991, Southwest dedicated 100% of its jet fuel needs in 2000 alone to futures contracts. They were so deeply hedged in this way that if they did something wrong, it would probably have unraveled quite badly, but they did it really well. From 1998 to the summer of 2008, Southwest saved an estimated $3.5 billion versus the average jet fuel price paid around the industry. 83% of Southwest’s profits in that decade were from hedging mastery. And so Southwest Airlines invested in these oil futures by entering into these long positions, long fuel hedging contracts with a variety of oil producers. These contracts allowed Southwest to buy crude oil at a fixed price over a specified period of time, thus avoiding the volatility of the actual market. And the contracts also allowed Southwest to efficiently manage their fuel costs, protecting them from sudden increases in those fuel costs.
Now, don’t get me wrong, I think other airlines definitely do this, but Southwest did it particularly well based on this performance. So we talk about barrels of oil as a really powerful futures contract. In fact, the Brent crude oil is very strongly correlative to the jet fuel futures contract, which I’ll talk about in a sec. The point, though, is that when you buy oil, the overall price of oil is impacted by these different sub-components and the demand for those sub-components. Jet fuel being a sub-component of a barrel of oil, about 8% of any barrel of oil is going to be refined into jet fuel. And just as a side note, I think this is just more interesting than anything. Chemistry-wise, this is what a gasoline compound looks like over here, and I’ll link to the description at the bottom where I got this screenshot from. But this basically shows that you take your crude oil and you can convert it and you heat it up and based on the molecular structure, the different types of oil are separated out in this chamber. This is called fractional distillation of crude oil process. So one of the elements is basically kerosene, and you can get into more nuance. There’s lots of great YouTube videos on jet fuel and the future of jet fuel. I highly recommend there’s one Google that one.
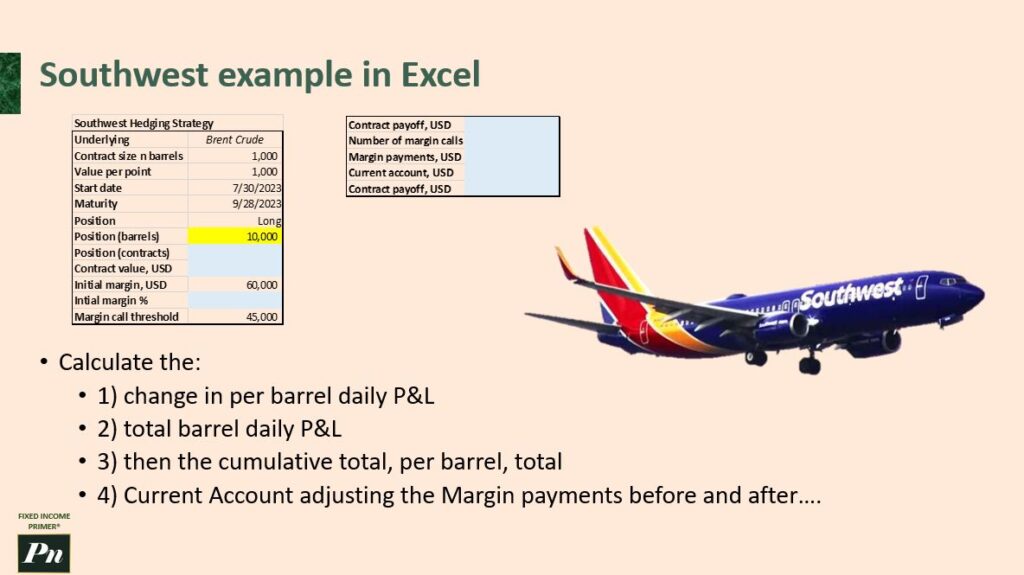
Southwest example
But the point is, what we’re going to talk about now is jet fuel a little bit more. There’s the futures contract specifications. We haven’t really touched too much on the details of it, but there’s a jet fuel futures called the Gulf Coast jet fuel Platts futures, and it’s on the CME, the Chicago Mercantile Exchange, the Chicago Board of Trade, and CME combined. So now they’re all under the CME Group in Chicago. And so one futures contract is 42,000 gallons, and on expiry, you have to deliver this oil within a 100-mile radius of Houston, Texas at the contract price. Unless you trade for cash, you settle in cash.
And so you’re buying and selling these jet fuel futures contracts. You need to understand the representative reporting of these contracts, all this detailed stuff, how it’s the nomenclature, it’s the age. And so you have the underlying jet fuel, you have it in a huge portion. It gets delivered to Houston, Texas. It has a specific futures delivery date, all of this nuance. I’m not going to show in what we’re going to do next, which is an Excel spreadsheet. So a great way to learn is to do things in Excel. And so the associated Excel spreadsheet has an example here of the Southwest Jet Fuel example, and I’ll just point out, though, we’re actually talking about Brent crude oil, which is a strong proxy for the jet fuel futures. They’re two different commodities, but the Brent crude oil is, you know, it’s a type of sweet crude oil while jet fuel is really referring to aviation turbine fuel, kerosene. There’s the US and then global versions, which freeze at different temperatures. This is just an example.
Let’s go through this process. I’m going to ask you to calculate out a couple things. So you need to calculate the change per barrel daily PL. Now, if you remember, the PL was all about at the end of the day closing prices and then the total barrel daily PL. You’re going to need to also calculate the cumulative total per barrel total, and then the current account adjusting the margin payments before and after. These are all the different subset tasks in the Excel. And so the blue fields are the ones that you need to populate. So I’m going to let you dive in there, see what you can do with it, and then unpause the video, and I will go through it with you. So here we are. We’ve got this Brent crude example. This airline is going to take a hedging position by going long because they believe the price is going to go up in the real market. And they’re going to enter into this contract in July, and then they’re going to need the actual underlying in September, end of September. And so this is the contract. I’ll call out NEDL, and I’ll link to the description there, the channel that helped build this model. This is largely based on their model. So I want to draw your attention first to the contract size in barrels as specified by the exchange, and then the value per point, which is also an important metric, or value per unit, which is another important metric to understand as well. So looking down here, we’ve got our dates into the future, and we’ve got our spot price.
What is the spot price? It’s the current market price throughout this period. So all this data below indicates the actual prices, the spot market at the time. So we’re looking backwards in time. This is all historical data. This contract’s already been conducted. This contract is now finished, and we’re looking at it now, historical. So as you can see, it’s measured in USD per barrel. USD is the global reserve currency, so a lot of oil is determined in USD currency, even to this day and likely ongoing. Although there’s some debate about dedolarization. And a barrel is just, remember, it’s a measure of the volume of oil. It’s a container, basically. And then we have the futures price. And this is measured units per contract. So as you know, the contracts per barrel is static. Usually, the exchange sets it at a thousand, for example. And so this is a in the market price. And as you can see, it’s contango. It’s upward sloping. It’s higher than the spot price. So the first calculation you should do is the futures USD per barrel.
Now, this contract is fairly simple because you’re sending the per unit contract to the futures contract. Then you have to multiply that by the value per point, and then we will set that static. And then divide by, oops, static. And then divide by the contract size in barrels. And this will get us, in this case, this exact amount here. This is trivial in this case, but in other contracts, it could be more complex. I’m going to double click here, and it’ll go all the way down to the bottom. And you’ll note that all the fields appear the same across these. So now I also want to draw your attention to this. This is the end of September futures contract, and this is important. It’s the very last trading day of that month in 2023. That is the maturity date, and that fits the conventions on the exchange. We’ll even talk about that.
Obviously, with bonds, it’ll be the same story. You have a window in which you can deliver the asset. So and typically, in this oil futures context, it is, in fact, at the end of the month that the contract expires. So with these commodities, you have to have one specified day of the month for the expiry. As I was just mentioning, bonds, you can have it across an entire month. But for what we’re doing right now, oil futures, you have a specific date in the month so that there’s not too much fragmentation. Everyone is landing on the same date for this very specific commodity. So this airline is taking a long position. They want specifically the number of barrels they want is 10,000. And so in the manufacturing or in the airline or the industry itself, in this case, they do want the physical oil, let’s say maybe. But they don’t actually have to take it. Again, they have a long position. They can actually settle in the financial sense, in the financial risks and cover their exposure to the change in price, as we’ve discussed before. So while this is an airline, and yeah, sure, airlines need oil, they need specifically jet fuel, they don’t necessarily have to take the underlying at the end of the contract, as we’ve discussed before. In other words, they can settle in cash. In other words, they can settle in cash. So again, they’re financially hedging their risk of this ever-changing price in actual oil forwards contracts.
However, you might have a specific relationship with jet fuel manufacturers, oil producers at the Gulf Coast, etc., to actually get your true supply that supports your airline. Those are separate streams of effort. This is the specific financial stream of effort that we’re focused on. And of course, with futures, with forwards contracts, you can negotiate the specific date and time. It can be very flexible because it’s a contractual obligation that is not a tradable asset on an exchange. It’s not standardized. So now let’s answer the question on positions. Well, how many contracts do we actually need in this case? So I would go here and I would select, okay, we’ve got 10,000, and we want to calculate this out. It’s 10, the denominator is our actual contract size in barrels, and the position in barrels is our numerator.
And that gets us, obviously, you can just see it’s 10 contracts for $10,000 of capital. You need 10 contract sizes to fulfill your obligation, to fulfill your request. So the contract value, in this case, we can calculate this by going simply taking our futures price at the start of the contract, again, the Monday. So technically, I should change this to this number. So on Monday, July 31st, so we go contract value equals this number times our contract position, and I’ll get us our answer of $392,500. The other way we could do this also, though, is to go instead, we would take the unit per contract, times it by the number of contracts we have, and then times it by our point value. And that would get us the same answer.
But let’s go with this one here to get our calculation. So now we’ll talk about initial margin. We’re now familiar with that and the margin call threshold. We’ve had, I’ve demonstrated what those were before. These are basically how the exchange makes sure this is a safe place to conduct these transactions and also avoids intentional default. “I’d like to get out of this contract, so I’m just going to walk away from the exchange and wipe my hands at this contract because I don’t like the way the contract is going. It’s not advantageous to me.” No, the exchange makes you cross their palms with capital, cross their palms with silver, is the proper expression, and say, “Okay, yeah, actually, I need to continue this contract, and I’m financially obligated to do so. I can’t just simply say, ‘Oh, I entered into this deal, and now I want to walk away.’ They’re financially obligated to participate through to the end because they have to put this capital down. It protects the exchange, who is the one taking the actual risk because, remember, two counterparties, they don’t need to know each other at all in the futures market. And so this is a mechanism to protect them. So as I mentioned before, you can actually expect the exchange to change the initial margin percentage. It can vary depending on the contract, depending on the circumstances.
They can make these modifications. But here, as we can see, the initial margin I have to cross their palms with is $60,000. And we have this. And so our current contract value that we’re putting into this, so our initial margin as a percentage of the capital we have at stake is 15.29%. So I want to draw your attention to the process of how the price over time starts to narrow by the very end as you get very close to the settlement date. The futures price and the corresponding spot price really narrow and get back close together. So we’ve talked about that before in the prior sections. So this shouldn’t be a surprise.
This makes sense because now you know the period in which you are really making a gamble on the decision of what the price should be should be narrowing quite fast. So now, again, we’re in a long position. So in our circumstance, what do we want to have happen? Well, ideally, we want the actual spot price to go higher over time so that at the end of the contract, we get the oil at the price that we agreed to, the futures price, which is lower than the market price. If the market price goes up to, oh, so good, yeah, $45. It went from $37. Our futures price was $39.
So we’ve made a little bit of a profit here and we’ll show how that works in a sec, but just to point out what the whole purpose is again. Now we want to do the daily P&L, so to get the per barrel calculation, we’re going to take a look at the change, the daily change, right? Because this is a mark-to-market, we take this number, then we minus our initial transaction price that we agreed to. So in this case, we’re probably not too happy because we basically could have entered into the contract a day later, and we would have got a better deal because our futures price is lower a day later and the actual spot price is lower correspondingly. So that all makes sense.
The key though is we want to take a look at it over the whole period of the transaction, and then to calculate the total daily, we want to take this number and then multiply it by our ten thousand dollar or ten thousand position, the number that we need to get a calculation out of this. We get that number. One thing I should have done is I should keep this static, so I just press F4 that keeps that static and then it’ll draw down and I’ll take a look at where we are.
So I’d be kind of nervous now because we’re kind of in the negative territory quite a bit. You might not sleep too well every night, and that’s one of the risks in the financial market. You can either eat well or sleep well, and we’re trying to eat well here, and we might not be able to. It looks like because look how much we’re losing on a daily, relative basis. So the key here too is this is calculating the incremental profit or loss on a daily basis, and some days are good, some days are bad. So now if we want to get the cumulative P&L, we need to tag this against this number. So equal this price, but we need to base it against what we’re actually going to pay at the end of the contract. We want to peg it against the original price that we’re committed to, and we press F4 to lock that in, and this is going to give us not the P&L daily, it’s going to give us our P&L cumulative, which we really care about. So double click here and it goes all the way down. So with the cumulative payoff, you’re seeing a different story from what I would have been panicking about if I was worried about this on a daily basis, right? So now you start to see a cumulative structure, and by the end, it’s a different story from where I was concerned on a daily basis.
All these fluctuations, this wild volatility, is what we’re trying to control against. We’re trying to hedge against. So now we also want to get the total, and we do the same process, as you can imagine, just like here. The total, we set the per barrel times our commitment that we’re putting in financially, and we get this number. And then add a cumulative rate, we get that number as well. So suddenly, at the very end, we have a different story, and we end up winning a significant amount of money here, sixty-two thousand dollars. And that’s not too surprising because the end price of the contract ends up being quite a lot higher than what we committed to, and we are going to get the set amount of oil at this price rather than these prices here or this specific price. So as a result, the difference is our payoff. So now, at the top of the screen, we have contract payoff in USD.
We know that it will be this cell down here. That’s the quick and easy way to do it after we did all this work. Another way to do this, though, is to compare the end price of our futures contract minus our original price that we entered into. And then we multiply that by, of course, our ten years, and we get the same answer. By getting, by virtue of getting the same answer, we know that these are now whole. We’re getting the right mathematical process in place. So now let’s talk about margin payments and initial margin. We understand that you put this sixty thousand dollar commitment in place in order to enter into this contract so that there are fewer strategic defaults, i.e., where someone enters into a contract and says, “Oh well, I have no margin payment required, and I’ll just go and buy this spot and just wipe my hands of this contract.” So these cheating people, the people who are, I guess, dishonorable when they enter into a contract, that’s all netted away.
That’s all just not possible because, and what makes the exchange so powerful is as a solution, they create a compensation mechanism using these margin payments to ensure that counterparties would never consider walking away without fulfilling their obligation. It binds the two counterparties who never meet each other and are matched, as we discussed, in a forward and futures contract setting. And so for our current account adjusted by mark-to-market, in the first field, this was sort of a trick question. We don’t actually have any current account adjustment to be made because it’s the first day of the transaction. But the margin payment, for sure, is going to be sixty. And then our current account after margin payments, this is simply a combination of this number plus this number that gives us our sixty thousand is the current account after margin payments. So now it’s day two, and we want to get this mark-to-market calculation, which is the adjustment to the nominal amount based on the incremental gains or losses on that given day, as we showed before. So in this case, we need to do a simple calculation here. We set this number here pinned as the end of the day calculation, and then we need to take our P&L daily total and add that together. And now we see we’re down 5000, which makes sense. But remember, margin payment is still the sixty thousand.
This is a nominal tracking process. We don’t actually take five thousand dollars out of your account. So now margin payment, so the exchange will politely ask you if you get too close to the margin call threshold to politely ante up and add a little more into your account, and that is to ensure that your nominal amount of your account is back up to your original margin. So now we want to test if we are near the margin call. So we would do, if this number is less than this number, then we would calculate out this number minus this number is what we would top it up to. We have to top it up back to our sixty, sorry actually, we’ll put it up here because this is static. By this number, and if otherwise, the margin account is zero. Now we also want to make sure this is static, that it locks into C14 in all circumstances, and this locks into C14 in all circumstances. And then finally, we use the same process we did before, which is this plus this calculates out our current account. So we haven’t broken this margin call yet, and so the exchange will let us roam free in the circumstance. But let’s apply this across all the remaining cells in the story to see if there was any requirement for a margin call. And so, as you can see, we’re constantly marking our account to make sure we are in a good spot. And here we have an unfortunate situation right off the bat the next day. We had a major cumulative loss now of 22,700, which pushes us way below the 45,000 threshold. So, in fact, we have been margin called here on this day because we have dropped past the 45,000 threshold, nominal current account adjusted mark-to-market. We’ve dropped quite substantially, and in order to continue to participate, you actually have to punch yourself back up to the 60,000 mark, and that’s what we’ve done here.
If you didn’t do that, then they would confiscate your capital as is, and the exchange would wipe their hands of you, rather than anything else. And usually, margin calls are triggered and administered by your broker, not the actual exchange. The middle person between you and the exchange is the one that manages the margin payments, especially in the retail futures examples’ context. There might be different arrangements depending on, I think Southwest might have a different arrangement, for example. But if you look at this going forward, let’s say we had another period. I just played around with this number. It used to be 37.94. Everything’s going dandy, and your futures contract is actually increasing in value. The futures contract, by the end, $45, you entered in at $39. So overall, you get compensated $39 for the barrels of oil, but the price in the spot market is $45, and the spot market price particularly is $45.16. So you’re happy because you took a long position. But in certain points of the journey, you aren’t sleeping well, particularly if we just do this example here where the price goes down. Let’s just change the number just to illustrate. Okay, now you have to do a margin call. You’re margin called, and you need to pony up $42,400 just to get back in the game. So put this back up, simulated, these are all simulated prices. If it was $31.94, you actually have to pony up big time if the price goes quite haywire. And this would be kind of a systematic price. Maybe the price down here wouldn’t be realistic going forward anyway if it went to $30.32.94.
And in fact, the spot price might have adjusted dramatically. Like, I don’t think that circumstance too often, but it can occur in systems of high volatility that, “Oh, wow, you keep on striking past your margin call, and you need to pony up to participate and continue to participate in the transaction.” So those are significant risks that you take on if you enter into these futures contracts, and that’s something to be aware of. But at the end of the day, this is a happy story because, again, you got $45 worth of the barrels you asked for, but you’re paying $39 worth of barrel. So your net victory here is sixty-two thousand dollars, and you committed almost four hundred thousand dollars to make sixty-two thousand. So now we want to calculate the number of margin calls. So what we would do here is we would highlight this cell, do equals, and this is definitely something you would use a lot called count if. Count if enables you to basically create a viable way of tackling a range. You do shift control all the way to the bottom, press the down arrow, that populates all these fields. You don’t need the margin payments. We’re only interested in the number of margin calls. And very simply, just do ending of the bracket. Sorry, you don’t do any of the bracket. You have to do a quote, greater than zero, is what the criteria is.
And that’ll tell you what the margin call is. I don’t think we need a bracket here, so make sure you get that. And then, boom, now you have one. So if I were to add an additional margin call, let’s say we did 32, you would get two margin calls. And this will come up in a sec later. We’ll talk about why that’s a big deal. Margin payment. So margin payment is the sum, how much money did you have to put in to continue to play, but to start off as well. So Ctrl+Shift again, down arrow highlights the entire field, and then we close the bracket. That gives us our total. Now we do our account current account status. That’s actually going to just simply be this number here, and we can press enter. That tells us the total. Now contract payoff. We already have the contract payoff, right?
We calculated it this way. We took the ending price minus the starting price times our position and number of barrels. That gave us our total of 62,000. Here, all we actually have to do is take this minus this, and if this number is correct, then we know our math all adds up. 62,000. So there we have it. Now understanding more broadly the great financial crisis and a lot of financial crises happen when we don’t have enough money to back these margin calls. So imagine if it wasn’t just one, it was, you know, 10 different margin calls or the giantness of this margin call, like, “Oh, I have to pony up so much to continue to participate.” I mean, this would be wildly… Like, the spot price would have to have dropped massively as well for this to occur.
But in a complex system with all these other futures contracts going at the same time, there would be massive panic around having to do this one margin call if there were a lot of margin calls and there isn’t enough liquidity, i.e., enough cash in other accounts, you know, or we’d have to borrow from… We’d have to sell other securities to get the margin call capital together to cover the margin call capital. And you have to do that really fast. Then you really enter into a crisis mode, especially if more and more and more people are impacted by, “Oh, he took or she took their money out of bonds or they took them out of equities to cover these margin calls.” Then you start to have a more system-wide impact. So the… There are a lot of risks with futures. So let’s go and continue our study here. Now I want to do an example from a short position. Provide a little context. We’ve already talked about this before. Basically, Phoenicians and the Greek traders carried their goods for sale around the new world. We had the Dodoma Exchange, and then we had the Chicago Board of Trade, which through rail routes from the north and Canada and the Prairie and grain-producing states went and put their materials in Chicago for exchange. And then once you got to Chicago, it’s really easy via waterways to go up to the St. Lawrence River, St. Louis at Seaway, through Montreal, for example, and then down the Mississippi River to get to the Gulf of Mexico to trade globally these goods.
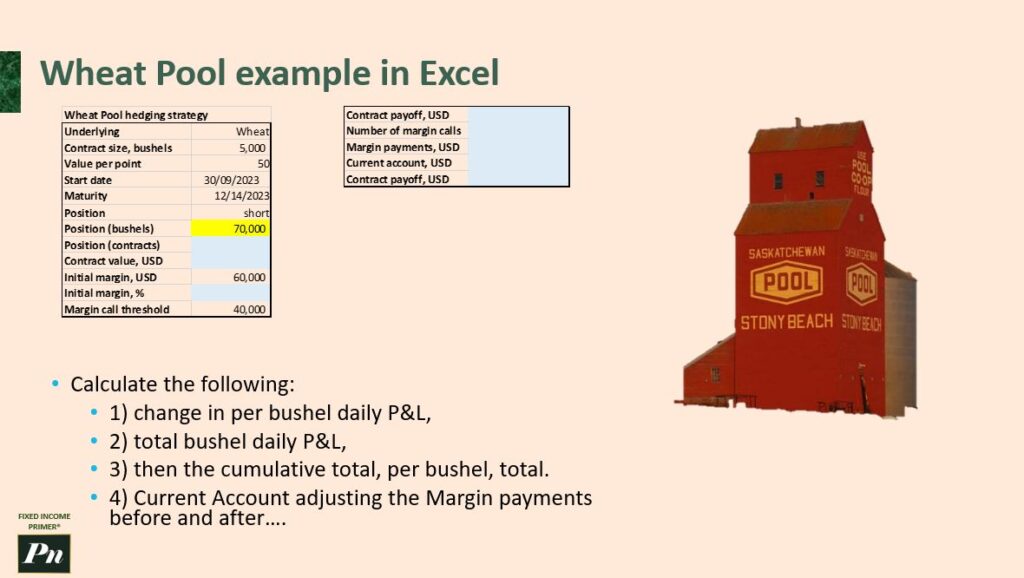
Wheat pool example
And so, of course, with agriculture, there’s seasonality. We’ve already discussed the supply and demand. There are huge gluts and then sudden shortages that lead to chaotic prices if you don’t stabilize things through a futures model. And so naturally, clearing grain exchange was a key innovation in the United States in the 18th century, and that’s built on the concepts around managing the risk, having transparency, liquidity, price discovery. Everyone generally knows what the price of these things are and the general security through the margin process. You have to ante up if you are a participant. So that stabilizes the risk of default. And so all of this system is really exciting. Grain is a great example.
And so, I want to talk about this example of grain and use the wheat pool. The wheat pool was an association of Canadian grain farmers formed in the early 20th century, 1920, to ensure a stable price and reliable market for their wheat in the face of unstable and often disastrous fluctuations in prices and agricultural commodities. The wheat pool would buy directly from the members and turn and sell and deliver to the markets. So, the wheat pool was later organized into the Saskatchewan wheat pool in the late 1930s, and it existed until I think 2013 when it merged with another source, Agricore United, to form Vitara.
But just as a general example, wheat as a commodity, we know the underlying is wheat here, the contract size is 5,000 bushels. I’ve got this example here, the blue fields should be populated. See if you can pull this off. It’s gonna… I’m gonna ask you to do the same things we did in the prior section, which is change in bushel daily P&L. We need to know that, we need to know the total bushel daily P&L, then the cumulative total per bushel, and then the current account adjusting the margin payments before and after. So now that we’ve done the jet fuel example, or sorry, the Brent crude example, let’s go in here and complete this example.
I think this time you’ll have an easier time since we’ve gone through an example to answer these questions. Unpause the video when you’re ready, and I’ll walk through it with you. So here, we’re going to walk in the shoes of the Saskatchewan wheat pool. They have this commodity, the underlying wheat bushels are 5,000. That’s a convention that dates way back. The value per point is set to 50, and we start date in September, end of the harvest season in Saskatchewan, and then maturity December, mid-December.
And as I said before, fixed income, there’s actually a whole month window. Some commodities have a specific date, so there’s no fragmentation of the market. You have to land on the date, and this one is mid-December. Now we’re taking a short position. So if we’re taking a short position, we have wheat in our possession and we are putting it in the market, and we expect the price to go down. In this hedge that we’re taking, we’re saying that if the price goes down, then we get a cash benefit. We’re taking a position of seventy thousand bushels. So we’ll note here the spot price for the commodity per bushel is 475. Now we’ve got units per contract. This isn’t really convertible too easily, it seems initially, but what we have to do is we take this current Futures price of 598, then we multiply it by the points value per point, and then we divide that by 5000, and that converts it into a comparable measurement to a per bushel rate. Because remember, a unit in the contract units is 5,000 bushels, and this is just representing one bushel.
So we have to bring this number down to its equivalent per bushel measure. And in order to make this work even better, I have to do F4 here and F4 here, so those fields are static. And then I’ll scroll down here, and it will provide the prices alongside the spot prices throughout the entire period. And you’ll see here below there’s a significant gap between the spot and Futures price, and it arguably will be higher in the wheat commodity sector than oil because oil can be packed in very efficiently. It is a liquid form, so it gravity pushes it down perfectly, whereas wheat is kind of bunchy, and bushels are a measure, but they take up air.
You can actually end up shipping quite a lot of empty space in the process of shipping or during wheat. So there can be some inefficiencies there, although I’ve seen grain actually in its unrefined form. I was going to say which is flour, but in a grain form, and it does it is fairly efficient. There is going to be a gap between the Futures price and the spot price to reflect the storage costs and then also some convenience yield calculated in there to offset the storage costs. So now let’s talk about what we’re trying to do as the wheat pool. We are saying we’re going to harvest 70,000 bushels. And so we need to get the position of the contracts because we’re hedging those bushels in the market. In exchange, we’re going to get cash. So we’re going to take this number, 70,000, and divide it by the contract size bushels, the number of bushels, which is 5,000, and that gives us a position of 14 contracts in this situation. Now, to get the actual contract value, we would take the number of contracts times it by the position that we’re taking in terms of bushels, and then we would multiply that by the value per point. And that’ll give us 369,600 dollars.
Another way to calculate this, which would be just as equally effective, is to take the Futures value per bushel that we’re entering into, and then the total position in the number of bushels we are trading, and that gives us the same answer. So that means we’re making a lot of sense. The initial margin in percentage terms, this is basically asking us to take the 60,000 and divide it by our contract value, and that gives us the 16.23 percent. Now, margins are usually a little lower than this, I will say, but that’s okay. It’s usually between three and fifteen percent.
It can vary, depends on what the exchange is saying at the moment in terms of the risk of the underlying. Well, to get the P&L daily for a purpose bushel analysis, because we’re in the short position, we care about the calculation of this number, which is the second day minus the initial entry point. So here, we’re actually not doing well because we’re gaining 12 cents on this. If we’re in a short position, we ideally want to see the prices going down, as we’ve discussed multiple times before. And to get the total P&L per day, we would multiply that by 7,000, and we get 8,575. So, I realized I did something wrong here. The price has gone up, but that’s not good, and we want to reflect the short in a positive light. So, we want to invert the polarity here. So we’re losing 12 cents in that case. And then our totals.
Now, what happened here? I failed to pin this down permanently. That’s an F4 function that’ll peg it so that it’s always this field that’s being pulled and then do this again. Then we have a better reflection of what’s going on.
Now, if we want to get the cumulative total, we have to peg against our initial position that we take. Make that an F4 and then minus by this field so that as it goes down, it will cumulatively calculate it. And then do the same calculation here as we did before, multiply that by the 70, make sure that 70 is pegged, and then we get the numbers cumulatively over the period.
So, as you can see, actually by the end of the contract, the price has risen quite a lot. Remember, the number is 5.94, and we entered into the contract at 5.28. If this was a long position, I’d be thrilled. If this is a short position, which it is, it’s not a good situation. We’ve actually lost money on this one.
Now let’s do account adjust. It’s not a big deal because we are a wheat producer and we have to honor this contract. But you win some and you lose some. So the current account position is going to start off at zero, and we’re going to post our initial margin, which is the 60,000, just to play the game. And then we will sum these two and 60, and that’ll give us our calculation, our current account after margin payments for the given day.
So, on the first day, we did have to post the 60,000 to participate. Knowing the outcome, we probably wouldn’t enter this contract. But we didn’t know the outcome when we started this contract, of course. So now this is where it gets interesting. Once again, we have to take the total here and then multiply it by whatever is in this field, which is P&L. It looks like we’ve lost some money here, so we’re now down. Fortunately, the threshold is forty thousand, so not a huge deal yet.
So, as we said before, you have to set up an if statement. If this cell is less than the Margin Call threshold, which was forty thousand, and we pegged this permanently by doing F4, then we have to top up by the difference between this number, which is obviously 60, minus this field we already selected here, minus this field. And if it’s not, then there’s no action to be taken, and there’s no need to bring up more funds to participate.
So the math here says, “Oh, we don’t actually need to do anything there.” This again is just this number plus this number. And so, at the end of the second day, we are now, in nominal terms, 51,425. So we’re already losing a little bit on this contract.
Now we’re going to take this and deploy across all the fields into the future to get a taste for what has happened to us. And it looks like we had two margin calls early on in the process where the price did drop pretty significantly. And now these margin calls then necessitate us to pony up, as I’ve said before. And if we don’t, then we lose our position entirely. And so here we did it twice in a row on these two particular days where there were significant gains in the price. The price went up even further.
The Exchange would be worried that we would cut the deal, stop, no longer want to fulfill our futures commitment in this short position we’ve taken, and just go in the spot market and sell the actual commodity that we already have. Right? We have the wheat. We could just go in them and instead of allocating that seventy thousand for this Futures Contract, take that money and just sell it in the market and make a profit. Now, well, they block that by ensuring that you have to participate here, or else you lose your 60,000 initial commitment.
So, as you can see here, we had two margin calls, but otherwise, we’re good. So let’s do a contract payoff, which is easily done here. The contract payoff is going to be 45,000. We lost forty-five thousand dollars here. And we’re going to do the countif function again, which was really useful last time because what it does is we highlight the range. Two ways to do this. I would take actually shift and control and down arrow. And then we would go comma and then quote greater than zero. Note the comment and then note the incident.
And there are two incidents of that nature. Then to get the margin payments total investment that we had to make, we would go here Ctrl shift and down to collect all the fields. And you can see here’s a hundred thousand margin payments in total. There was 60 to start. Here we populate the current account, what the actual end total is of our current account, which is slightly north of what we initially put in. And as you can see, there’s a significant disparity. If I go this number minus this number, it should equal the contract payoff amount as well. And it is.
So therefore, all our math ends up adding up here. And in this story, it’s not a happy one because we did lose 45,000. Well, forty-six thousand dollars in effect in this transaction because, again, we took a short position and the price actually went up. And we’re a little disappointed, but not a big deal. This is one of many wheat pool hedging contracts, and it’s quite a challenging field to be in, agriculture generally. So that’s it for this section. And let’s carry on.
Now let’s outline some additional concepts that exchanges have in place to support their market. So price limits is a concept where there’s an allowable range of price movements in the futures products in each trading session. And on the y-axis, we have ticks or points. On the x-axis, we have time. So during a trading day, if the price or the ticks go down below a certain limit, which is known as the limit down, then trading will either halt or stop for the trading day. Conversely, if they go too high, they will also stop, halt, and for the entire trading day.
And this is the regulations that determine that specific outcome. In the equity indexes, there are three levels of expansion on the limit down: seven percent limit down, thirteen percent limit down, and twenty percent limit down. And then on the upside, there’s overnight a five percent limit up and five percent limit down. The point is this exchange has another layer of protection against massive volatility where there are margin calls and people have to generate more capital to stay in their futures contracts. The exchange also has this system to say, “Whoa, whoa, whoa, let’s pump the brakes. There’s something wild going on in the market, and we need to halt trading at this time until we figure out what’s going on in terms of the actual market behavior.” And this is known as the price limit range, and this range is adjusted and calculated daily and updated so that the exchange follows where the market is going. If the market is generally going up or the market’s going down, this range moves up and down with that. So there’s another level too, and it’s called price banding, and that’s around the bid-ask spread, well the spread and the prices.
So this is the spread, you know, 104 and 105, there’s a spread of one. But in this illustration, the actual banding though is the actual maximum price that you would pay and the lowest possible price in that range. And if it goes beyond that range and your bids or your asks aren’t fulfilled if you are outside of this range, now if that range moves up and you have a resting order, then it will be triggered, and you will have the opportunity to transact. And so that’s a good two dates you can set or good to cancel. But over the last few years, the markets have very few limit ups and downs. But it’s important to be aware of these pricing rules in the marketplace.
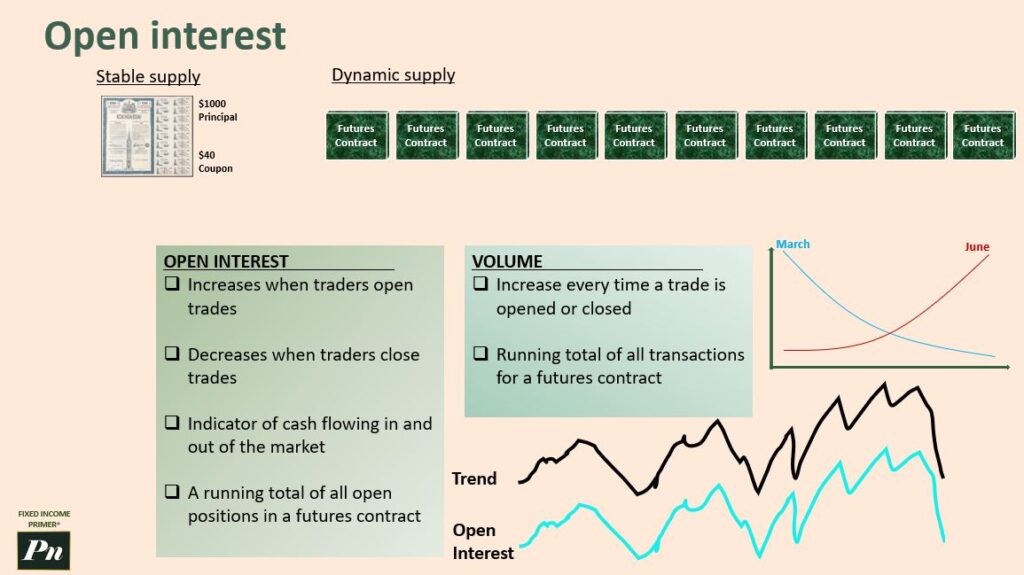
Open interest
So another really important concept to understand is open interest. And open interest, very simply, is the total number of futures contracts held by market participants at the end of a given trading session or trading day. If you remember earlier on when we looked at Trader A and B and how that could expand to thousands of traders through the support of an exchange, instead of interacting one to one with each other, you could interact with a wider group of people.
Suddenly, we’re really talking now with open interest about an indicated market liquidity and critical mass. The number of contracts out there indicates how popular this particular futures contract is. Large open interest is usually indicative of a lot of market participants. So you would have institutions, hedge funds, retail investors, and arbitrages, etc., all participating. When you have a lot of contracts out there, open interest is also an indication used by futures traders to determine market sentiment and strength behind price trends.
So unlike the stable supply in this case of this Government of Canada Bond, the futures contracts can vary widely, expand and contract based on sentiments and based on where people are in the market. And so because of that dynamic supply, you have quite a different way of looking at it, and you can actually expand the scope of this Government of Canada Bond’s impact on the broader market because you can have bets on that underline. That’s why open interest is an important concept to understand too. It’s showing that dynamics apply. If I were to basically hammer out, you know, key tenets of what an open interest is, it increases when traders open trades, and it decreases when traders close trades. Again, it’s an indicator of cash flowing in and out of a market. So you can see if the futures contract for a Government of Canada Bond is declining in its open interest, then you’re seeing capital is leaving the futures relating to Government of Canada Bonds and moving somewhere else. And what does that indicate? What sentiments can we draw from that information? And the key too is that it’s a running total of all open positions in the futures contract, and it has to be made public. So it’s very useful for people.
So, citing this from Bionic Turtle (a link in the description), I’m going to show you using Excel how open interest works. We’re going to use the example of wheat futures. A bushel, 5000 bushels, is one contract of wheat futures. So, Alan here decided he wanted to do 300 contracts, and this is the long position. So, at the end, he’s going to deliver cash in exchange. He’ll get wheat, and someone is going to take the short position on that one. So, um, that, by the way, 1.5 million bushels of wheat, a lot of wheat. Bob is going to take the opposite position; he’s going to take the short. And so now these 300 contracts work together, and we’re even Stevens. There’s a match. And so you might even say this is a forward contract because Allen and Bob could just meet up and say, “You know, I have 1.5 million bushels of wheat,” Bob says, “and Alan says, ‘I have the corresponding amount of cash, and let’s do a deal in a forwards contract sense.'” But we’re going to put it into an exchange and futures context now, right, where they are actually contracted with the exchange itself.
Alan has a contract with the exchange, Bob has a contract with the exchange. The exchange novates these contracts, nullifies them, and then we’re only playing in the realm of the cash difference between the two contracts. But the exchange manages this whole process. The exchange is the counterparty, so that they aren’t taking on the risk of a forward contract where Alan could leave the country and not fulfill his obligation, Bob vice versa. The contracts are highly standardized so that an exchange can manage the risk and ensure that there’s security around who has what position in the contracts, and they can’t run away or not fulfill their obligation.
I will mention here too that there’s matching perfectly one-to-one here, or 300 to 300 here, but if there is a mismatch, if there are more long positions than short positions, what will actually happen is the price will adjust in the marketplace to make it more attractive for someone to take the short position. So, that’s an additional layer of nuance that we’re going to explore further, but right now let’s focus on open interest.
So, then also what we’re seeing here is the open interest calculation on the row J. So here it’s 300 total, not 300 plus 300. This is the total number of contracts in the market, 300, and this basically illustrates that this is a very tiny microscopic market, and there’s something wrong with this market with so few participants and so little open interest. Obviously, this is just illustrative purposes here. So, Christine opens a position of, let’s say, 250, and Dawn opens up the position of 250 as well, so short and longs are balanced out. So, note how the open interest has increased to 550. Now we have Alan taking an offsetting position on the long position. He took the Excel doesn’t quite work perfectly here because this is going to be negative 300, but what this really is is a short position he’s taken, and that nullifies his long position. So, he’s offset and closed out his contract, and that’s how you do that by basically taking the opposite position to close it up. And so someone else has to take the corresponding because this is a contract, someone has to take that additional position, and it’s Eric. He’s going to take the 300 contract himself. And now you see open interest is still even keel between longs and shorts.
So, then further to it, Christine takes another position here. Christine is offsetting or closing out part of the position by doing 125, and then Frank is going to randomly also select to enter a long position of 125, which is nice and convenient for this illustration, but the total remains 550 as a result of these transactions. So now Eric wants to offset half of his 300 long position, so he goes negative 150, and Bob decides to enter into the same, wants to go long 150 to semi-offset his existing position of which was the short of 300 at the very start. So, as you can see, the open interest reduces again because people are now withdrawing from the market. So, the market here in an open interest calculation will reflect the total number of active contracts in the marketplace rather than the total volume, which is another way I’ll show you in a sec.
So, then finally, we also have Barb is still has 150 out and wants to close that position. So, we’ll take a further long position to cancel out the short, and then Eric will do the corresponding opposite. And so, the ending total of open interest is 250 on the end of this trading day. So, Don still has 250 short, Christine still has 125 long, and so does Frank. And so, open interest and volume are very similar, but the key differences are that volume increases every time a trade occurs, and it’s also a running total of all transactions for futures contracts, whereas open interest basically tracks all the subtracted end-of-transactions. Open interest is a reflection of cash flow into the market and cash flow out of the market, as we said earlier, suggesting that, “Oh, this is a hot futures contract,” and helps to support trading decisions.
So, in a rough and tumble way, I just want to show how this would be called, you know, volume overall volume in the market by, um, just simply multiplying these two, summing these up. This would be considered the actual overall volume during a given day, and that would help indicate certain things, and it’ll go into detail how that would work. So, how volume helps with decision making is large changes in open interest can indicate when a certain participant is entering or exiting the market, but you want to get other clues with volume. So, volume can indicate the trader’s level of interest, overall the whole market’s interest on a particular future, and volume can indicate when to stop trading the front month futures contract and roll over to the next month. And we’ll talk about that in a little more detail in a sec. It also helps to show when a contract is most liquid during the trading day and across trading months or years. You can see patterns relatively that you can draw some conclusions about.
Now, some traders will look at the trends, and this is typically known as technical analysis, and it’s been widely debunked in academic circles, and generally, it’s not really a reliable means of evaluating the actual futures as well as predicting how things will go just based on this pattern and this shape. “Oh, well, it must, therefore, reach this threshold, and therefore it’s going to have to go down now because it went down a similar situation before.”
This is called technical analysis, and it’s only effective if everyone else believes in it, and unfortunately, most people will have some independent thought in mind, and they’ll do fundamental analysis and try to really understand the broader macro and micro factors in an economy to help decide how to invest. But specific to the rollover concept for March, you’ve got this is the front month futures contract, and so this chart just is attempting to show how the volume is declining over time, and so you want to choose a period when to roll over to the corresponding June contract, and it only starts to pick up after a certain point, and this is a remarkably reliable pattern you’ll see in the volumes data.
So, you can sort of time when to enter and exit a particular contract and roll over, right, especially if you’re not intending to follow through with the contract to its expiry, which is quite common. The other thing is if there’s a lot of volume in the contract, as there’s more volume in it, you will be able to take advantage of a narrower bid-ask spread because as demand increases, the corresponding supply drives the price in an advantageous way for the traders.
Major economic events or, you know, the Fed or the Bank of Canada or other central banks making a declaration are also points where you’ll see higher volume in futures contracts around that time of day. So, if the price goes down, though, in the contract, and the volume is going up, you can’t necessarily assume, although you might logically, that the trend is that the futures is going to continue to go down because just volume doesn’t really tell you what’s actually happening. It could be that people are exiting a position or there’s a new set of more long contracts coming through than short contracts, and you can still have the prices go down nonetheless. And so, you can’t really draw conclusions on the basis of that either.
So, we talked about open interest, now let’s talk about futures contract specifications again and really hone in and understand this cleanly. So, we did that prior slide, which compared futures and forward contracts. You know, was the forward contract world private, highly customized, etc., etc. Futures contracts have the two major distinctions of being legally binding agreements to buy an asset at a specific date or a month in the future. It’s legally binding, and then the second big thing is it’s heavily standardized. So, quantity, quality, physical delivery, time, location, all that good stuff is in there. So, we’ve got some classic oil futures.
I’ll do just a walkthrough of one, but so Brent oil ice futures, European exchange, it’s a cash-settled futures contract. That’s one oil futures, it’s really powerful and widely used, especially in Europe. The one that a lot of folks do focus on is the West Texas Intermediate, and it’s hosted on, it’s licensed through the Chicago Mercantile Exchange Group, which is Chicago Board of Trade plus Chicago Mercantile, that combined in there, the CME Group. In Canada, we have the TMX Group, for example. So, this is from the CNBC website. We’ve got West Texas Intermediate crude. This is the July contract 2023. This was recorded in May of 2023, so these prices are these mark-to-market prices and today prices. And what we’re really seeing here is people making specific commitments as to what they are willing to put down in terms of money on these bets.
And so, by doing so, you’re providing the broader market with this instrument, this WTI, a predictive model of how things are going to play out in the future. And people reference this to help inform other financial decisions as a result. So, this is really this price discovery. This is the financial market participants’ money putting money on the table and saying, “This is where I think the price is going to be. This is why I would take a long position. I’m going to take a short position.” And thousands upon thousands of people are doing this, and so you’re having this global contribution to what we think the future will hold.
Of course, we don’t have access to future points in time, but this is what we think is going to be appropriate in terms of my betting, my investment today, and so that guides and helps people make decisions in the broader financial system. So, it’s quite a fascinating piece of data that people use who aren’t participants, but certainly people who are participants are looking at all kinds of inputs, analyzing, doing fundamental analysis, maybe even doing some technical pattern recognition stuff, but mostly really thinking hard about where they want to put their capital, and then they’re putting it in these futures contracts, and that provides again a predictive bet as to what the future will hold without having obviously access to future events, which no one does. So yeah, West Texas Intermediate.
Let’s take a look at the fundamentals of it. It is a contract, per contract, 1,000 barrels of oil. That’s a lot of oil. And on expiry, the oil must be delivered or received at a pipeline or storage facility in Cushing, Oklahoma at the contract’s reference price. So, this is the symbol. It’s CL, as you saw on the prior slide there, the CNBC website. It’s CL is the nomenclature for how you find the contract, and the underlying asset is light sweet. It’s referred to, and that refers to actually the carbon dioxide and hydrogen sulfide components of the oil. So, at what ratio those exist in the oil, they call it light sweet.
And then again, quantity 1,000 barrels has to be delivered to any location that’s specified in the contract. It could be Henry Hub or Athabasca, Louisiana in this specific contract. I should say West Texas Intermediate. It goes to Cushing, Oklahoma, which is at the just the top of the state that I think is kind of shaped like a meat cleaver, actually, and it has to go to that location on a specific time.
So, all these key components, what the underlying asset is, quantity of the asset, the location of the delivery, and the time of delivery, or all parts of the contract. We’ve talked about this before. You might get a phone call. You imagine if you just take a long position, so you’re going to be receiving the oil in exchange for cash in December. You might get a call in November. So, where do you want your oil if you only have a long position? This might happen to you.
So, what happened also is, like, dude, we have someone who’s going to take the opposite position and cancel these out. You could just settle in cash. Cool, that’s awesome. But you know, we’ve talked about this before. That could be an issue if you don’t, if you just take a long position. Be very, very careful. Another risk of futures I mentioned probably a couple of times now. So, we look at this contract, and you can look at the daily volumes. This is the CME website screenshot in terms of the activity on the contract and the energy around. Why do we care about this contract in particular? Specific trading hours are specified here as well, and that’s an important thing to keep track of.
So, just expanding on the CL concept, right, this is the title for West Texas Intermediate. You’ve got Z and six. Z and six, if you’re in the US, you call Z, right, zed. Zed represents December, and these are universal across the different exchanges. Futures contracts, they have a letter to represent each of the corresponding months so that someone can quickly snap their fingers and reference CLZ6. That means December 2026. The six represents the decade that you’re in, typically, or if you’re at the ninth year of a decade, you can still infer that this integer indicates a future year. And by the way, an integer is just a fancy way of saying a number, right, a digit. In the next year in which the number six appears. So, this is 2026 in this case. That’s the name of this particular contract and tells you all the information you need to know, right, right on the ticker basically.
So, the contract unit and notional value are another aspect of the specification document that they need to understand. So, the contract unit is based on volume, weight, and financial measurement. We’ve seen this before. The contract notional value, or contract value, is the expression of the contract unit and the current Futures Contract price. It’s kind of a word salad, but how is this notional determined? Let’s take the e-mini S&P 500 as an example and see how it’s calculated. Well, it’s equal to a multiplier designated in the contract times the S&P 500 Index. So, whatever the whole of the S&P 500 is doing, you multiply it by the multiplier and you have your e-mini calculation.
Now, let’s talk about classic Futures contracts. One example is the COMEX Gold contract. The contract unit is a multiplier of 100, and the measurement is in troy ounces. Another example is WTI, which we discussed earlier. It’s measured in a thousand barrels. Again, the unit or multiplier is important to understand. For the e-mini S&P 500, it’s 50 times the value of the S&P 500.
Now, let’s take a look at some screenshots from late April. We have the S&P 500 Futures contract with a value of 4,150 that will be settled in June 2023. The WTI Crude contract, also settled in June 2023, is priced at 69.98. If you have the prices, can you calculate the notional values? Pause the video, take a calculator, and figure out what the notional values are. Then, unpause the video and see if your calculations make sense.
When you unpause the video, here are the results: 100 times 2,225.5 gives you just over 200,000 barrels of oil. This gives you a notional value of 70,000. The S&P 500 gives you 200,000.
Now, let’s touch briefly on hedge ratio and bond math futures. We’ll go into more depth on these topics in a separate presentation. But for now, let’s understand that value at risk needs to be divided by the notional value to calculate the hedge ratio. If you have a hedging strategy where you need to deploy 10 million dollars, all you need to do is divide it by the notional value to understand how many contracts you need to take a hedge position. This is a basic understanding, and we’ll delve into more detail later.
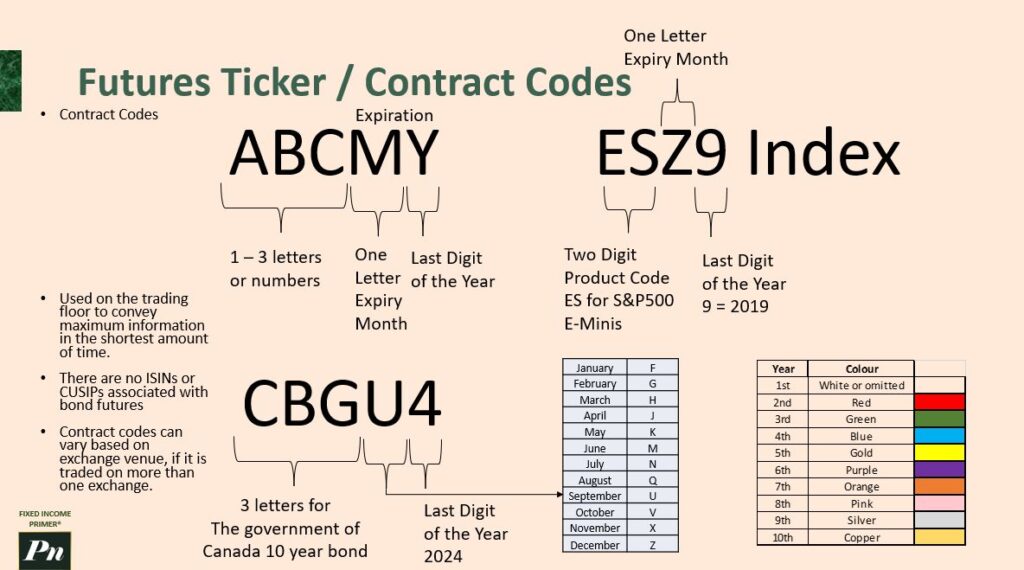
Futures tickers
Next, let’s talk about future tickers and contract codes. It’s important to understand them. The contract name, contract month, and contract year are the key points. There are no license or CUSIPs associated with Bond Futures. Contract codes can vary based on the exchange venue. If it’s traded on more than one exchange, there can be differences in the branding used. For example, the e-minis have the code ES for the contract name, and the letter Z is the expiry month indicator. The last digit represents the ninth year of the decade.
Now, let’s look at the government of Canada 10-year bond, which has the code CGB. The letter U represents the month, with September being indicated by U. Knowing these codes can be helpful for shorthand communication. Different color codes are used to indicate the year when looking at electronic trading. Understanding contract codes is critical for quick online searches or using a trading platform.
All Futures contracts have a minimum price fluctuation, also known as a tick. Tick sizes are set by the exchange and vary by contract instrument. For example, the tick size of the e-mini S&P 500 Futures Contract is a quarter of an index point, which is valued at 50 bucks. Therefore, a minimum tick would equal 12.50. The tick size for WTI Crude oil is 0.01, or one cent, with units at a thousand barrels. Tick sizes are defined by the exchange to provide optimal liquidity and ensure reasonable bid-ask spreads.
To find the minimum price fluctuation for any TMX Group contract, you can refer to the product specification page. This information is available for Futures Contracts on any global exchange, not just TMX. It’s important to understand these tick sizes for liquidity and trading purposes.
This concludes this video. In the next video, we will delve into Bond Futures. Thank you for watching the entire video. If you found it helpful, please subscribe, like, and consider checking out my online course on Bond Math, which you can find in the description or on my blog. I look forward to continuing the learning process with you. Let’s keep going, and I’ll see you in the next video.